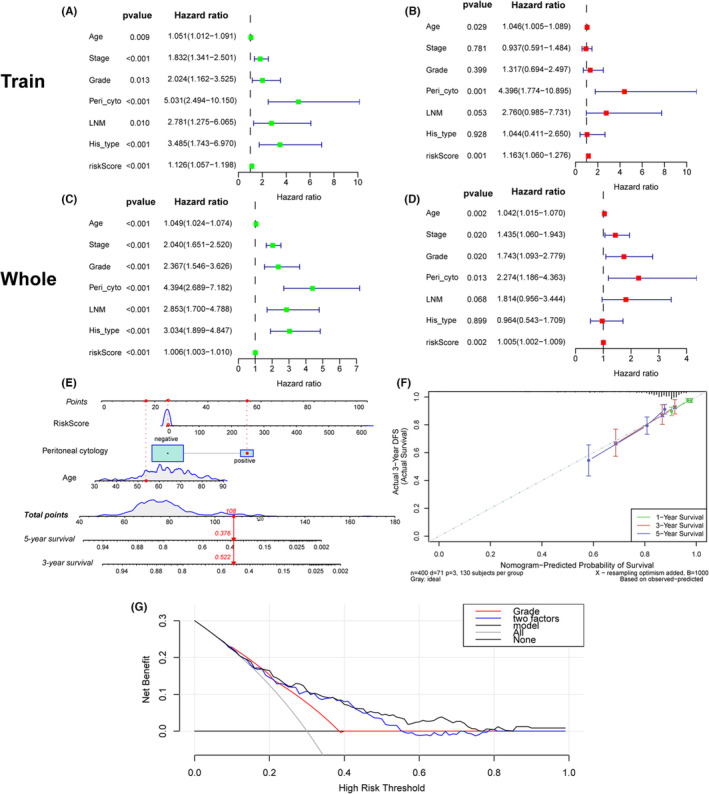
FIGURE 6.

Univariate and multivariate Cox regression analyses of overall survival in EC patients. Univariate analysis of the traning cohort (A) and the entire cohort (C). Multivariate analysis of the traning cohort (B) and the entire cohort (D). (E) Nomogram for predicting the probability of 1‐, 3‐, and 5‐year OS for the prognosis of EC patients. Three factors were included in this nomogram. (F) Calibration plot of the nomogram for predicting the probability of OS at 1, 3, and 5 years. (G) The DCA curve indicated that the prediction ability of the nomogram based on these three factors was great than any one or two factors.
