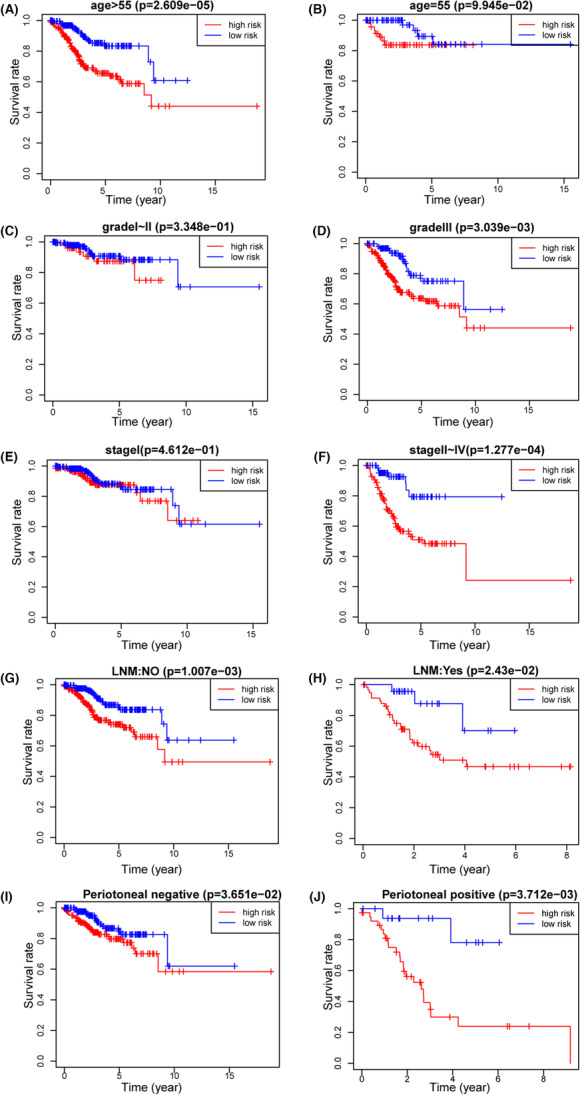
FIGURE 7.

Kaplan–Meier survival by risk groups for patients in the entire cohort and subgroups according to patients' age, stage, grade, and peritoneal cytology. (A) Age ≤ 55.(B) Age > 55. (C) Grade I–II. (D) Grade III. (E) Stage I. (F) Stage II–IV. (G) LNM: negative. (H) LNM: positive. (I) Peritoneal cytology: negative. (J) Peritoneal cytology: positive.
