
FIGURE 4.
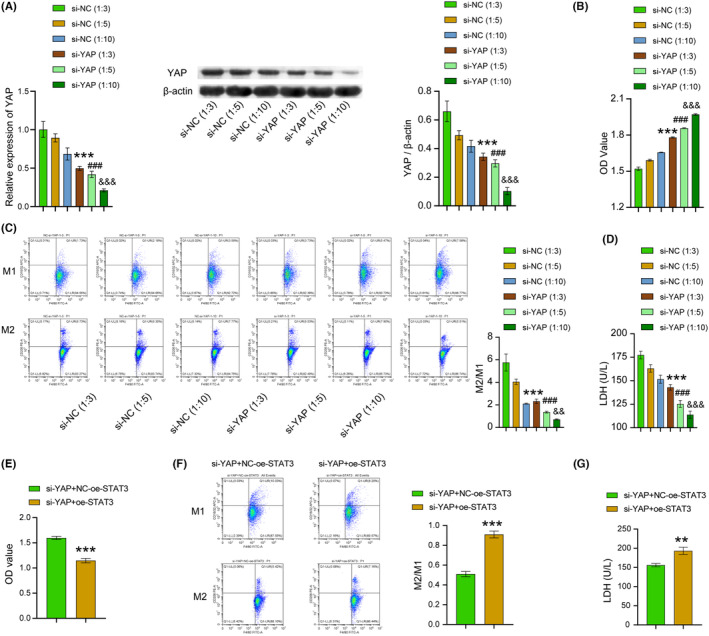
YAP/STAT3 promoted M2 polarization of TAMs and inhabited CD8+ T cell viability. (A) WB and RT‐PCR were chosen to test the expression of YAP in cell lines. (B) CCK8 was selected to examine the proliferation of T cells in cell lines. (C) M1‐ and M2‐type macrophages in cell lines were identified using flow cytometry. (D) T‐cell‐mediated cytotoxicity in cell lines was investigated by the LDH release assay. ***p < 0.001, **p < 0.01, *p < 0.05 vs the si‐NC (1:3) group, ### p < 0.001, ## p < 0.01, # p < 0.05 vs the si‐NC (1:5) group, &&& p < 0.001, && p < 0.01, & p < 0.05 vs the si‐NC (1:10) group. One‐way ANOVA. (E) CCK8 was selected to examine the proliferation of T cells in cell lines. (F) M1‐ and M2‐type macrophages in cell lines were identified using flow cytometry. (G) T cell‐mediated cytotoxicity in cell lines was investigated by the LDH release assay. ***p < 0.001, **p < 0.01, *p < 0.05 vs the si‐YAP + NC‐oe‐STAT3. t‐test. All data were presented as mean ± SD (n = 3) from three independent experiments, each performed in triplicate.