
FIGURE 5.
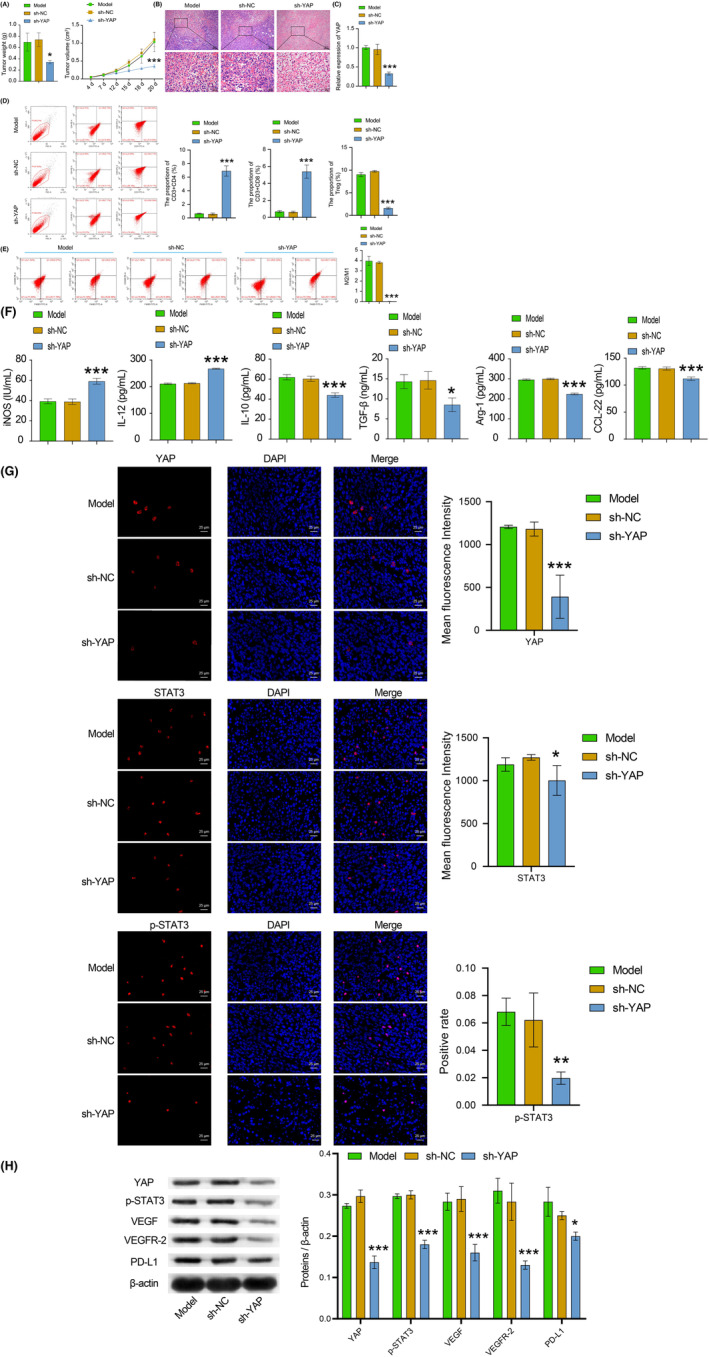
Inhibition of YAP could affect TME and tumor proliferation through the STAT3/VEGF/VEGFR‐2 axis. (A) The detection of volume and weight of tumors of mice. (B) The tumor morphological changes of mice were observed by HE staining. (C) YAP expression of tumor tissues was tested by RT‐qPCR. (D) CD3+CD4+, CD3+CD8+, and treg cells in tumor tissues were examined by flow cytometry. (E) The ratio of M1 and M2 macrophages in tumor tissues was tested by flow cytometry. (F) The iNOS, IL‐12, IL‐10, TGF‐β, Arg‐1, and CCL‐22 expressions were tested by ELISA. (G) IF staining was selected to examine the YAP, STAT3, and p‐STAT3 expression levels in tumor tissues. The red signal represented positive staining for YAP, p‐STAT3, and STAT3, while the blue signal indicated nuclear staining. (H) The levels of YAP, STAT3, p‐STAT3, VEGF, VEGFR‐2, and PD‐L1 in tumor tissues were examined by WB. All data were presented as mean ± SD (n = 3) from three independent experiments, each performed in triplicate. ***p < 0.001, **p < 0.01, *p < 0.05 vs the model group. One‐way ANOVA (A, left and B–H). Two‐way ANOVA (A, right).