Fig 2.
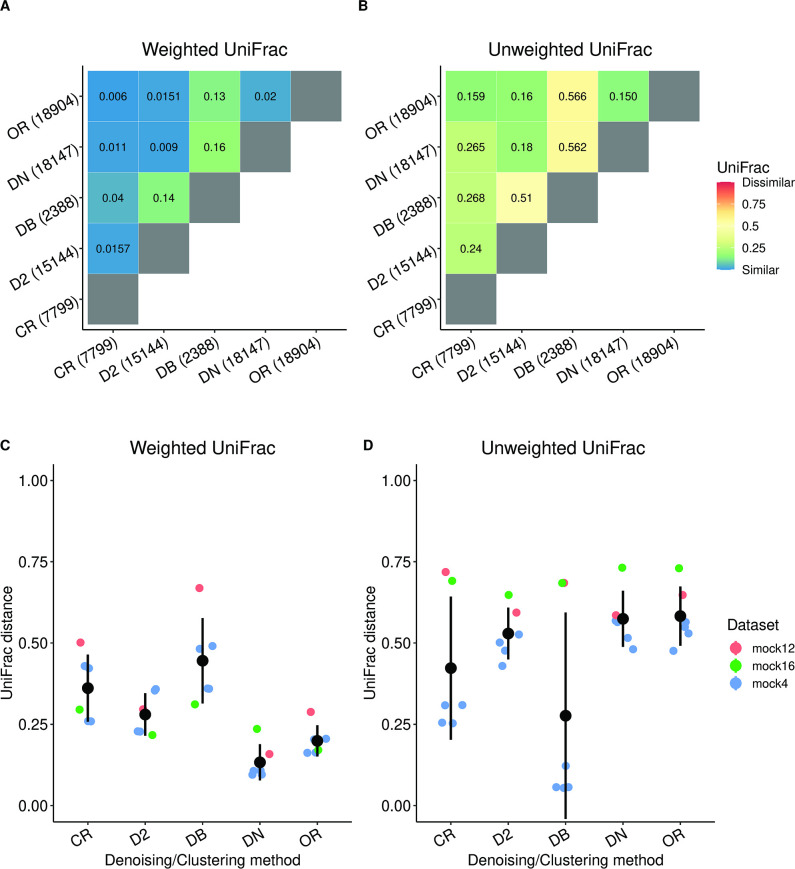
The representative sequences generated by the different denoising and clustering methods differ in their identification of sequences that are low in abundance. (A) The average weighted UniFrac distance between the representative sequences shows that the representative sequences and their compositions are fairly identical between the methods (with the exception of Deblur (DB) due to the low ESV count). (B) The relatively larger average unweighted UniFrac distance indicates that methods differ in their identification of sequences that are lower in abundance. The number of OTUs or ESVs generated by the respective methods is provided in the parenthesis next to their names. The data used for the analysis in (A and B) were the samples from the fecal microbiome transplant (FMT) data set (55), containing both healthy subjects and subjects with autism spectrum disorder (ASD). (C and D) The distributions of the average weighted and unweighted UniFrac distance between the predicted sequence profile and the expected sequence profile in the mock data sets. The average weighted UniFrac distances show that de novo (DN) and open reference (OR) were the best-performing methods in most of the data sets, while they are the worst-performing methods under the unweighted UniFrac metric. The good performance of DADA2 (D2) under both distance metrics combined with its approach of identifying ESVs using de novo methods prompts us to use it as the default method for the DC step. The data used for the analysis in (C and D) were the mock4, mock12, and mock16 data sets from mockrobiota (56).

