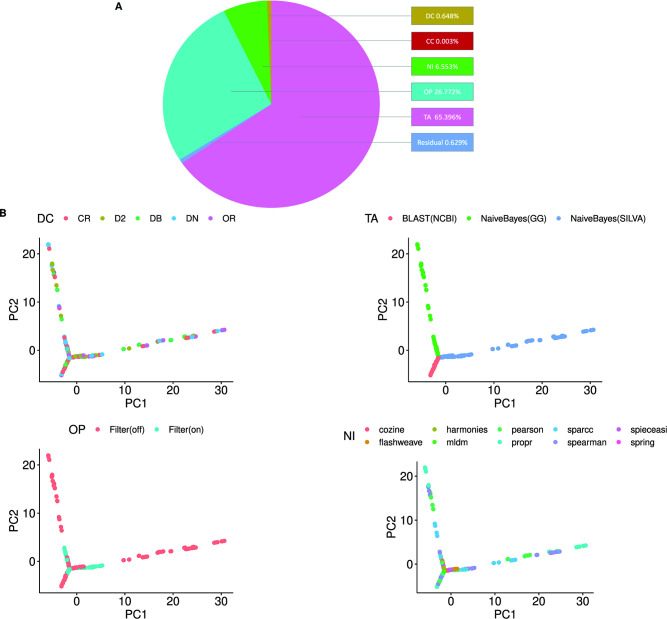
Fig 6.
The choice of reference database has the largest impact on network variance. (A) The percentage of variance in the networks (generated from the FMT data set) contributed by the denoising and clustering (DC), chimera checking (CC), taxonomy assignment (TA), OTU processing (OP), and network inference (NI) steps of the pipeline calculated using ANOVA on a linear model (see Methods). A weight threshold of 0.1 and a P-value threshold of 0.05 were applied to each network before the analysis. The taxonomy database contributes most to the variance between the networks (65.4%) followed by the filtering of the counts matrix (26.8%) in the OP step. The variation due to the NI, DC, and CC steps is much smaller in comparison (6.553%, 0.648%, and 0.003%, respectively). The negligible fraction labeled as the residual is an artifact that arises when multiple steps are changed at the same time. (B) All the inferred networks generated from various combinations of tools are shown as points on a PCA plot. Each point on the PCA plot represents a network inferred using different combinations of tools and parameters that are available in the MiCoNE pipeline. The color of the points corresponds to the tools used at each step of the pipeline (DC, TA, OP, and NI). The points on the PCA plot can be grouped based on the TA step, but the extent of this separation decreases when the filtering is turned on in the OP step, confirming that the variability in the networks decreased upon filtering out the taxonomic entities at low abundance. Some algorithms, especially the direct association methods, at the NI step can also be seen to generate networks that are less variable compared to the others. The DC step does not seem to have any correlation with the variation in the networks on the PCA plot.

