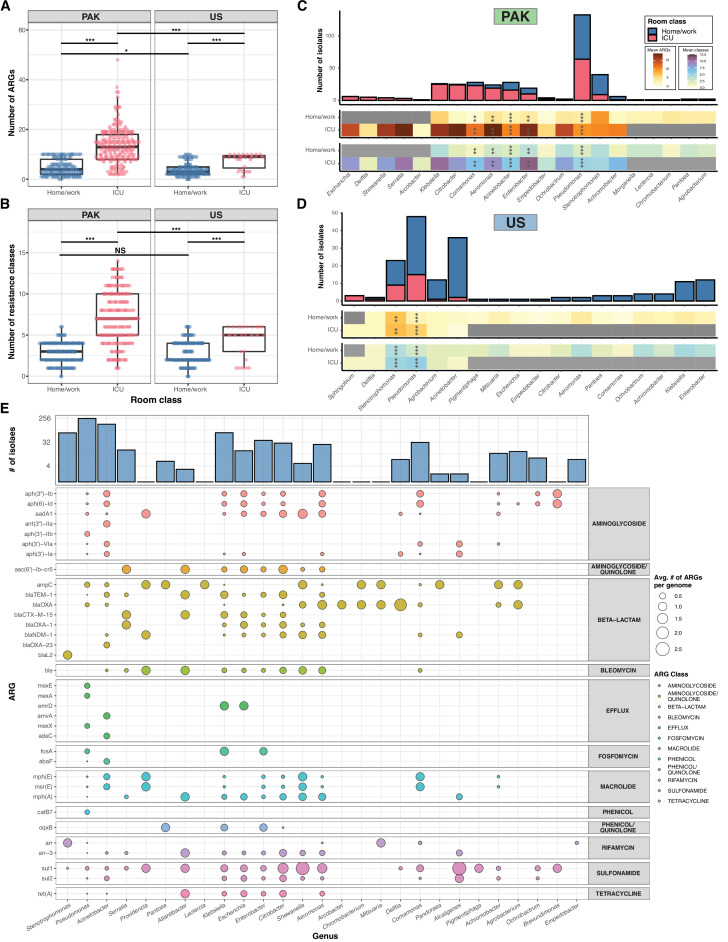
Fig 4.
Overall ARG content of genomes. (A, B) Scatterplot showing the number of ARGs and number of ARG classes per genome for all isolates (as predicted by AMRFinder), with small amount of jitter added for visibility. *** = P < 0.001, * = P < 0.05 by Wilcoxon rank-sum test. (C, D) Stacked bar plots showing absolute number of isolates collected from each genus in USA/PAK, colored by room class. Bars to the left represent genera found more in ICUs, and bars to the right represent genera found more in HOME/WORK rooms. Each bar is annotated with heatmaps showing the mean number of ARGs (red/orange) and ARG classes (green/blue) in each genus. *** = P < 0.001, ** = P < 0.01, * = P < 0.05 by pairwise Wilcoxon tests with Benjamini-Hochberg adjustment. Individual group sizes and ARG counts are noted in Supplementary Data. (E) Balloon plot showing the average number of times each ARG appears in a genome from each genus (num_ARG_appearances/num_genomes), colored by ARG class. For visibility, only the top 35 ARGs found in the data set are shown. ARG, antibiotic resistance gene; ICU, intensive care unit.

