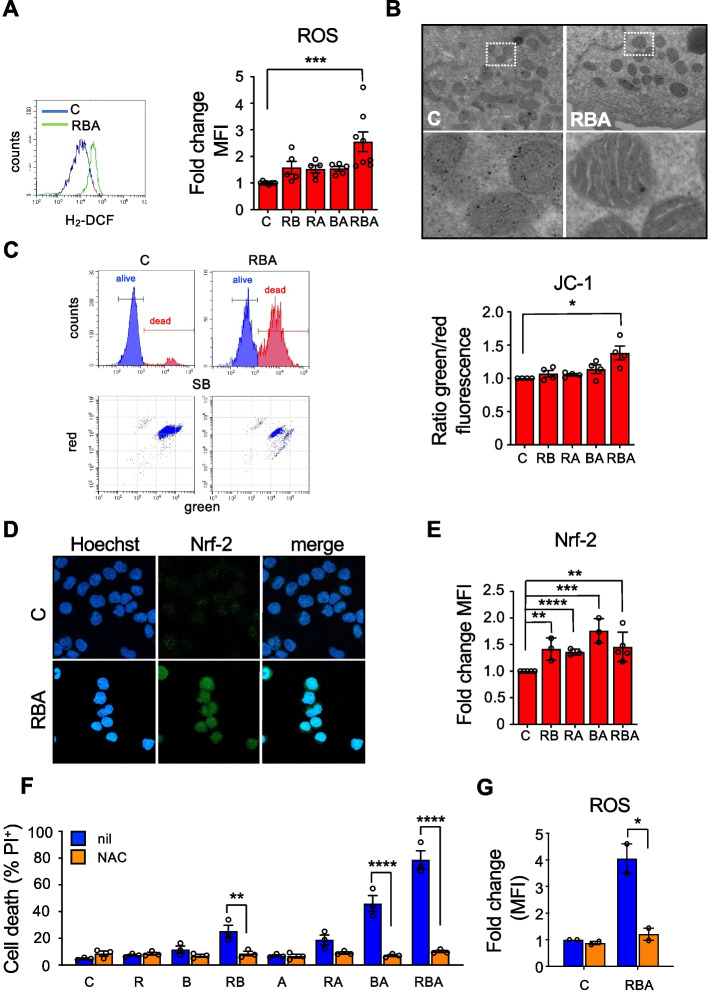
Fig. 3.
Oxidative stress is mostly responsible for the cytotoxic effect of the combination on MOLM-13 cells. A ROS levels were quantified in MOLM-13 cells by flow cytometry, upon the incorporation of the oxidation-sensitive dye CMH2-DCFDA, 48 h after RBA treatment (one-way ANOVA). B TEM analysis focused on mitochondria of MOLM-13 cells, 24 h after treatment; areas delimited in dashed squares in the upper panels are magnified in the lower panels. C MOLM-13 cells mitochondrial membrane depolarization, measured by flow cytometry as increased green/red fluorescence ratio of the JC-1 dye, 48 h after treatments. On the left are shown representative flow cytometry plots, on the right the histogram reports average values of the green/red MFI ratio. D Confocal microscopy images of MOLM-13 cells stained with an anti-NRF-2 antibody. E NRF-2 expression in MOLM-13 cells, 24h after treatment, measured by flow cytometry (unpaired Student’s T test). F MOLM-13 cell death was measured by PI exclusion assay, 72 h after treatment with RBA, in the absence or in the presence of 20mM N-acetyl-cysteine (left, two-way ANOVA). G ROS measurement, in cells treated with or without NAC, for 48 h (right, two-way ANOVA)

