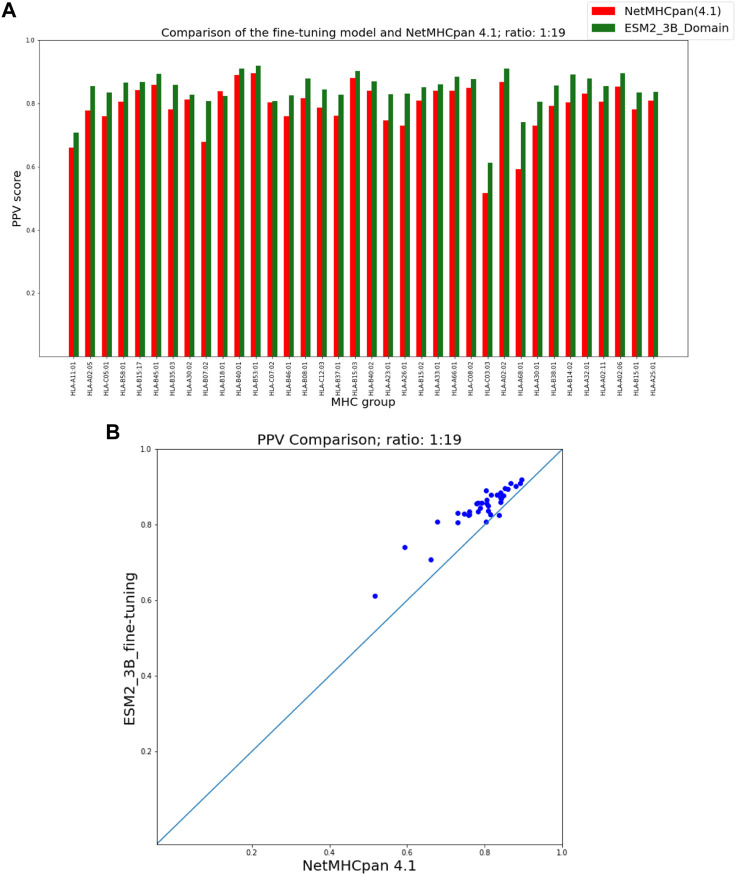
FIGURE 3.
PPV Comparison (hit-decoy ratio: 1:19) of our fine-tuning method with the latest NetMHCpan server (Version 4.1) over the same training and test sets (Reynisson et al., 2020). (A) Bar plots associated with each test set. (B) Scatter plot: each point is the PPV of each group of test set.

