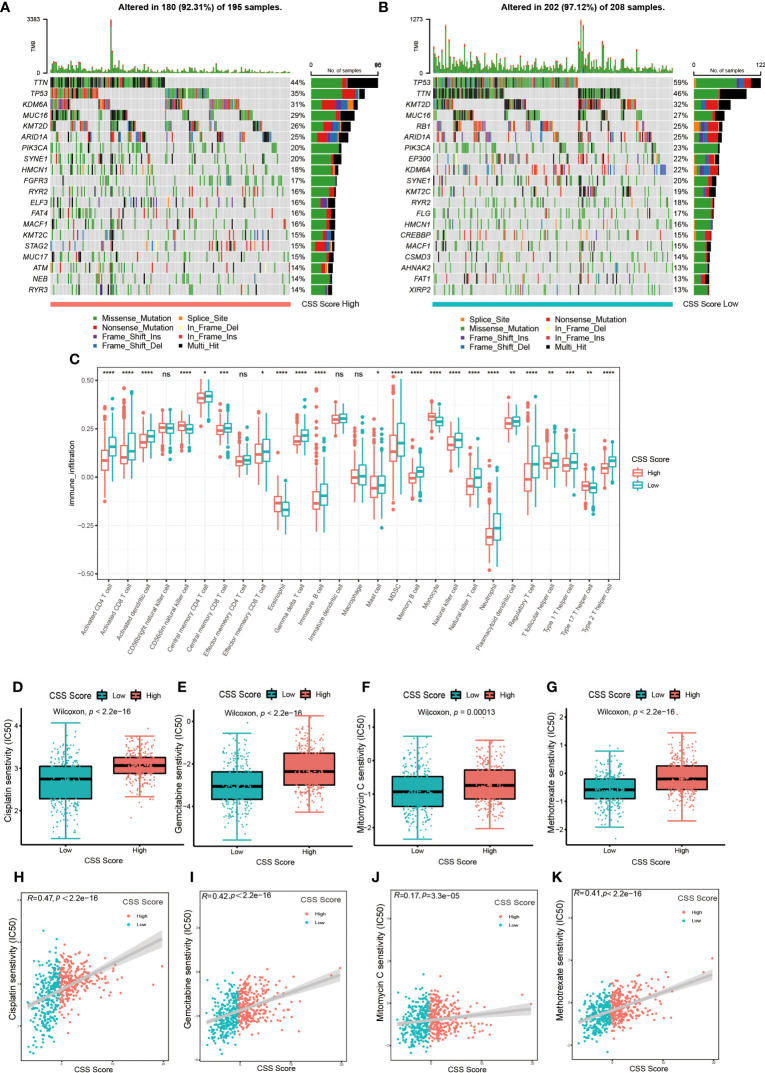
Figure 7.
The connection between CSS model and cell infiltration characteristics in TME, as well as chemotherapy response. (A, B) The waterfall plot of tumor somatic mutation of high CSS score group (A) and low CSS score group (B). (C) The comparison of the abundance of immune cells infiltration in high and low CSS score groups by ssGSEA (*p< 0.05, **p< 0.01, ***p< 0.001, ****p< 0.0001; ns, no significance). (D–G) The differences in half-maximal inhibitory concentration (IC50) of chemotherapy drugs between high and low CSS score groups in the training set. Cisplatin (D), Gemcitabine (E), Mitomycin C (F), Methotrexate (G). (H–K) Linear regression analysis for chemotherapy drugs sensitivity and CSS score. Cisplatin (H), Gemcitabine (I), Mitomycin C (J), Methotrexate (K).

