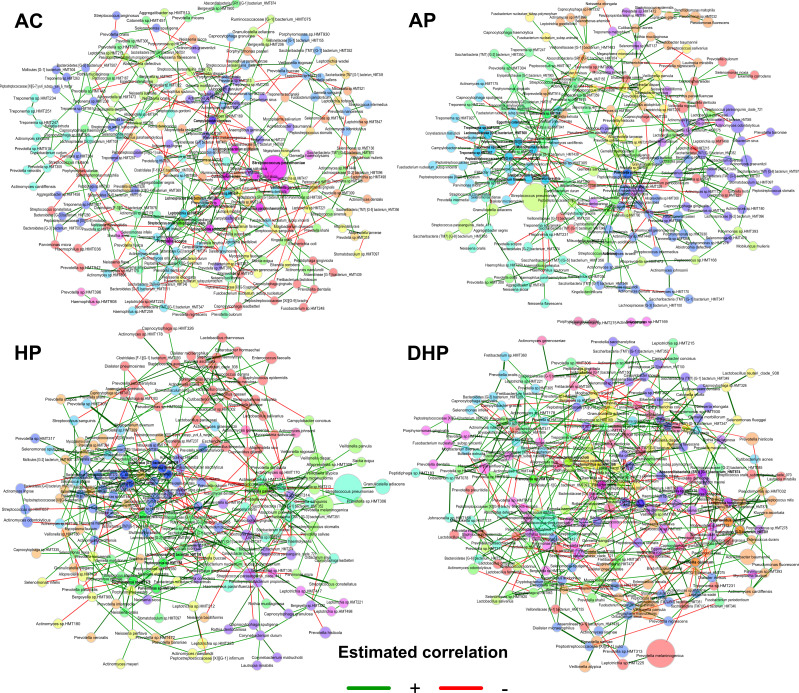
FIG 5.
Co-abundance networks for each clinical group analyzed with the SparCC method in the NetCoMi package. The size of the nodes was adjusted by a normalization of the counts, and a color was assigned to each subcluster within the network. Positive associations are shown with green connections and negative correlations with red connections.

