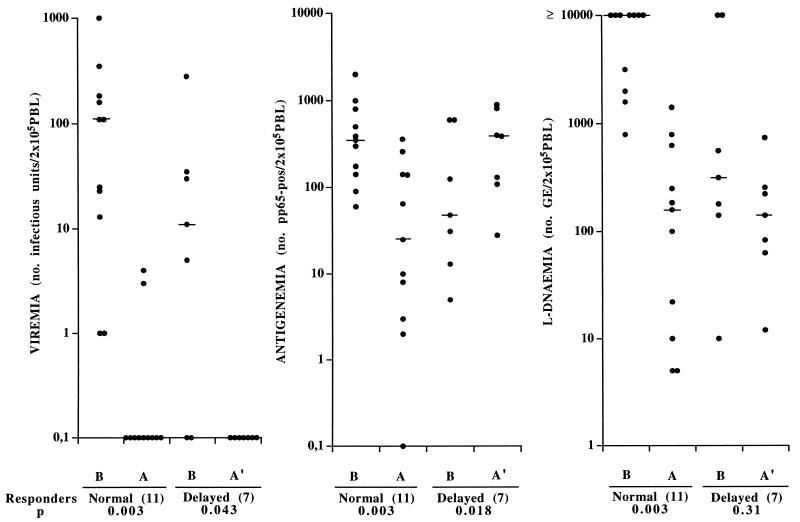
FIG. 1.
Distribution of HCMV viremia, antigenemia, and L-DNAemia levels in a group of 18 solid-organ transplant recipients with primary HCMV infection, including 11 with normal and 7 with delayed responses to antiviral treatment. Bars indicate median values. B, values before onset of treatment. A, reported antigenemia values referring to the earliest blood sample showing ≥90% progressive reduction in antigenemia level after onset of treatment; viremia and L-DNAemia were determined with the same sample. A′, reported antigenemia values referring to peaks of increasing antigenemia levels detected after onset of treatment; viremia and L-DNAemia values were determined with the same blood samples.

