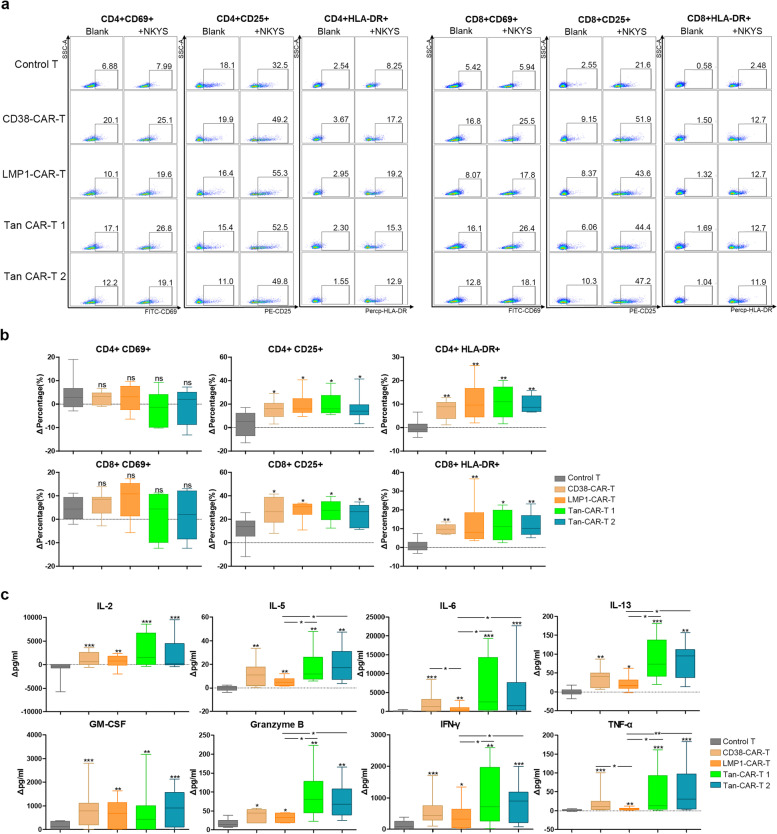
Fig. 3.
Activation and cytokines releasing of CAR-T cells co-cultured with NKYS. a Activation markers (CD69, CD25 and HLA-DR) expression on CD4 + and CD8 + subgroups of T cells were detected by FACS. b Statistical results of activation markers expression on T cells. ΔPercentage is equal to the difference between the proportion of positive subpopulation of T cells in the treatment group and blank group. c Cytokines released by CAR-T cells and control T cells were detected using the CBA Kit. Δpg/ml refers to the difference between cytokine concentration in the treatment and blank groups. A value of p < 0.05 was considered statistically significant. ns, not significant; *p < 0.05; **p < 0.01; ***p < 0.001

