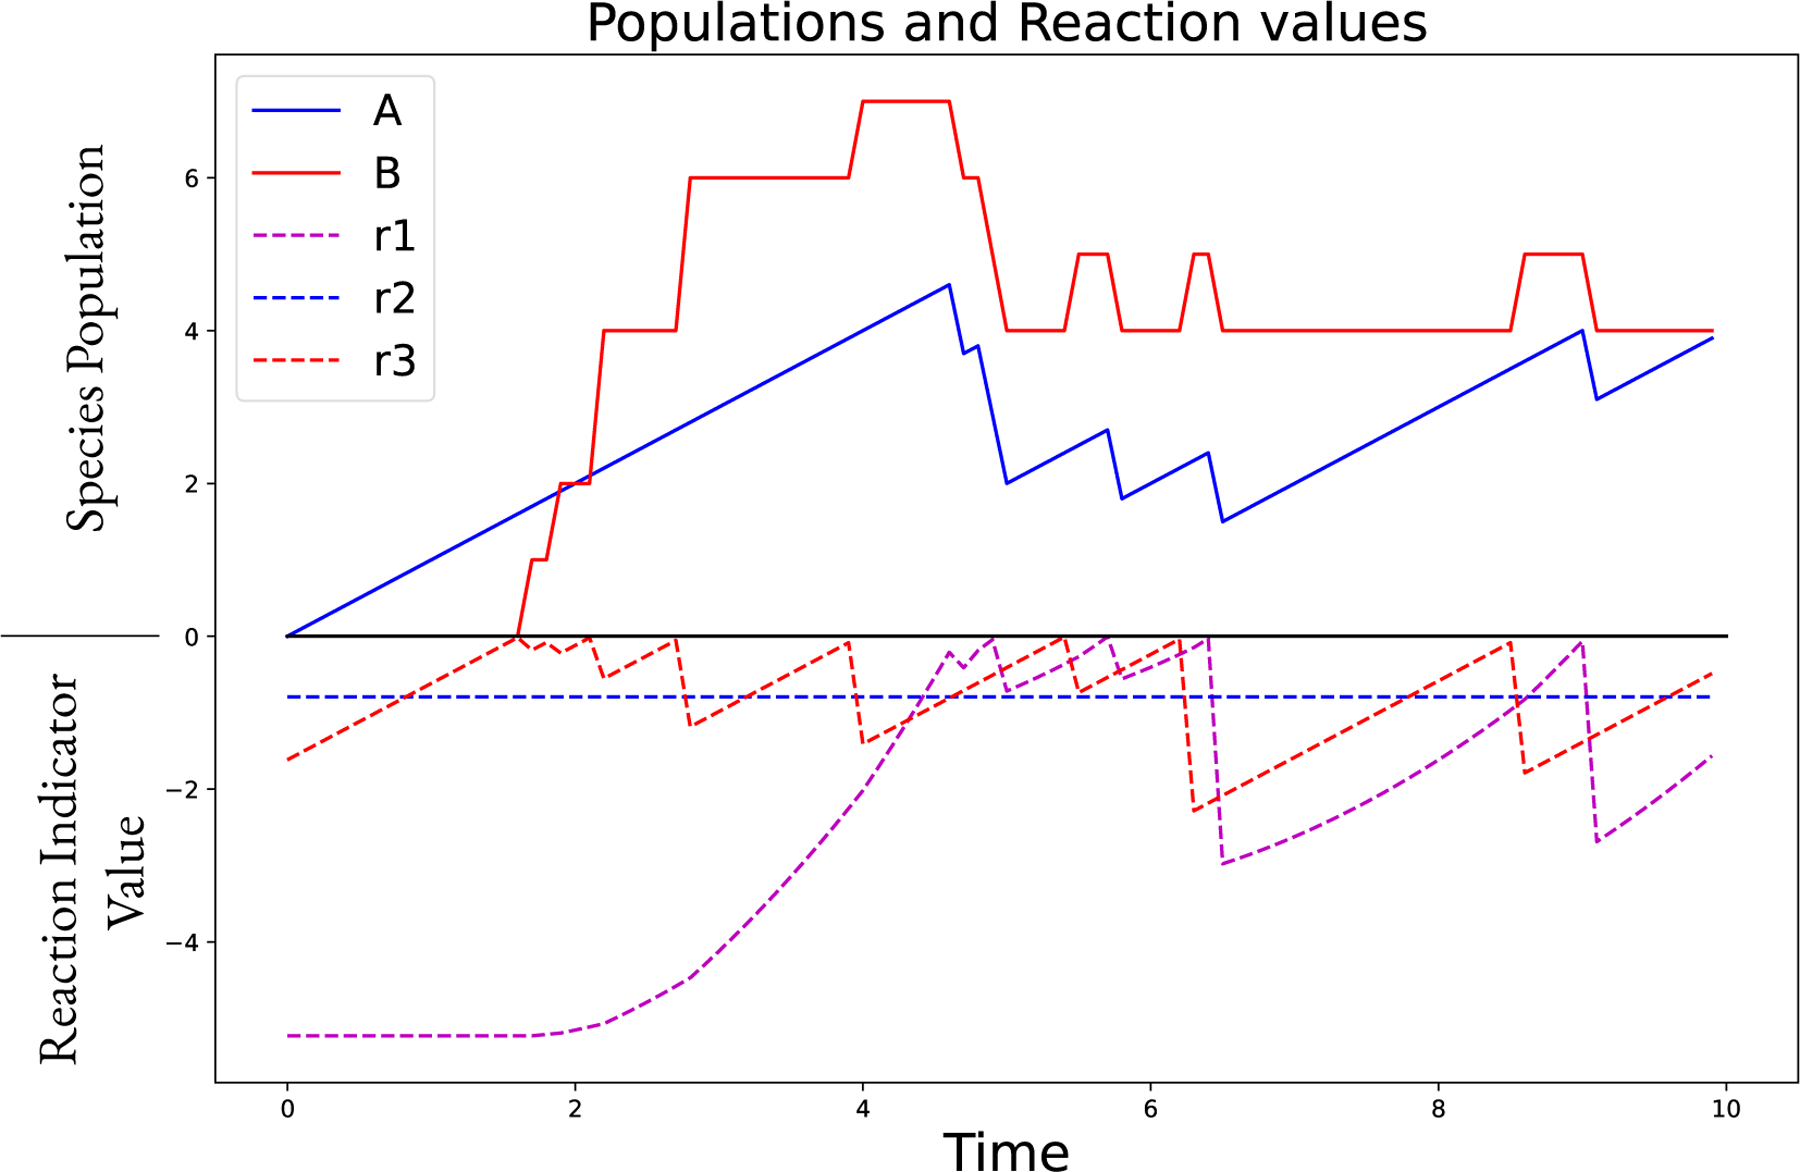
Figure 2:

Visualization of the Tau-Hybrid simulation of a coupled discrete-continuous system. The model features three reactions: , , . The values of the reaction indicator variables, , , and are shown along with the populations of species , which is set to be continuous, and species , which is set to be discrete. The population of changes discretely when or fire, which occurs when their value crosses the axis and becomes positive. We then use (11) to determine the number of times the reaction is fired and then reset the reaction indicator value to (a negative value). The reaction is simulated as deterministic because it depends only on species marked as continuous. Therefore, the indicator variable is ignored and the population of changes continuously. The population of also changes discretely when fires. The simulation step size is calculated adaptively, and the state of the simulation is sampled for output every 0.1 time units. All other options use the defaults (e.g., LSODA integrator).
