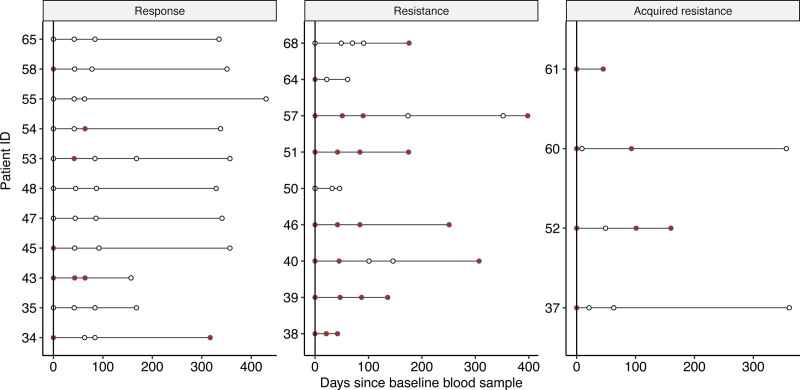
Fig. 3.
Driver mutation detection per response category. Dotplots showing driver mutation detection status over the course of the study. Y-axis shows patient ID, X-axis shows the days passed since the baseline blood sample was extracted. Dots correspond to blood tests taken, empty dots indicate no driver mutation detected, red dots indicate that driver mutations were detected in the sample.

