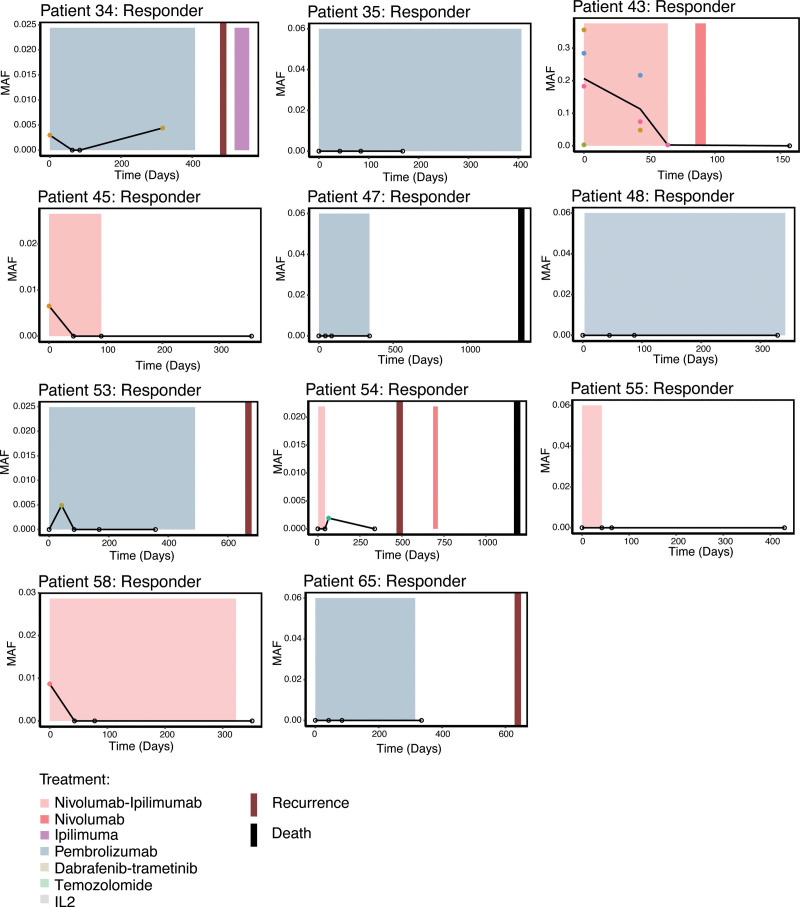
Fig. 4.
Longitudinal analysis of ctDNA in patients with response. Per-patient plots showing the driver mutations detected over the course of treatment and clinical history. Y-axis shows the mutant allele frequency, X-axis shows the days since the baseline blood sample. Colored dots indicate detected mutations, empty dots signify that a blood sample was taken at the time point but no mutation was detected. Black line connecting the time points corresponds to the mean MAF over time. Colored boxes show the type and time frame of treatment. Red vertical lines show the date of clinical progression, black vertical lines show the date of death. Dashed vertical lines show the date of PET/CT or CT scans. CT, computed tomography; ctDNA, circulating tumor DNA; MAF, mutant allele frequency.

