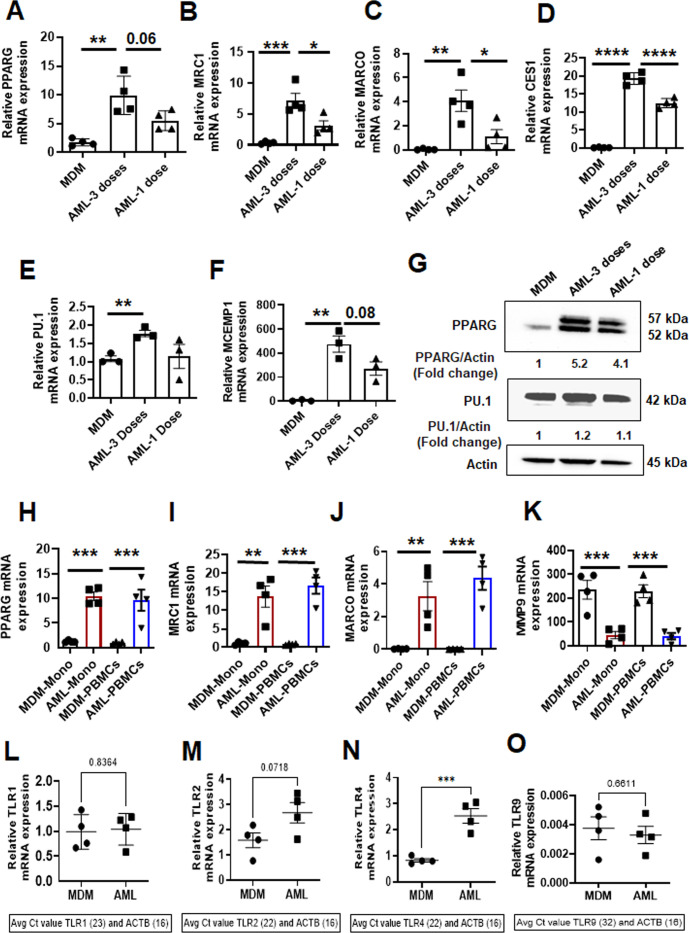
Fig 2.
Continuous supplementation of the lung component cocktail during differentiation is necessary to drive monocytes to AML cells. (A–F) PBMCs from healthy human donors were exposed to ALL cocktail (surfactant [Infasurf: 100 µg/mL] and cytokines [GM-CSF: 10 ng/mL, TGF-β: 5 ng/mL, IL-10: 5 ng/mL]) for 6 days after only one administration on day 0 (one dose), on alternative days (three doses), or left untreated (MDM). Gene expression of (A) PPAR-γ, (B) MRC1, (C) MARCO, (D) CES1, (E) PU.1, and (F) MCEMP1 was significantly higher in AML cells that received three doses of treatment than one or 0 dose. Each dot indicates an individual donor, n = 4. (G) PPAR-γ and PU.1 protein levels were also higher in AML cells stimulated with all three doses. Actin was used as a loading control. Representative blots from two human donors and the numbers below each blot indicate mean fold change relative to MDM. (H–K) Monocytes were purified by EasySep human monocyte isolation kit from healthy human PBMCs on day 0 (Mono) and exposed to ALL cocktail [AML-Mono: surfactant (Infasurf: 100 µg/mL) and cytokines (GM-CSF: 10 ng/mL, TGF-β: 5 ng/mL, IL-10: 5 ng/mL)] for 6 days on alternative days or left untreated (MDM-Mono). In addition, PBMCs were exposed to ALL cocktail for 6 days on alternative days (AML-PBMCs) or left untreated (MDM-PBMCs), then macrophages were purified by adherence. The cells were collected for qRT-PCR analysis of selected HAM signature genes (17). Gene expression was compared within the groups: MDM and AML cells that were matured from purified monocytes (MDM-Mono and AML-Mono) and MDM and AML cells that were matured in the PBMCs (MDM-PBMCs and AML-PBMCs). The qRT-PCR data show gene expression of (H) PPAR-γ, (I) MRC1, (J) MARCO, and (K) MMP9 expressed as relative mRNA expression normalized to Beta-actin control. Each dot indicates an individual donor. Data are expressed as mean ± SEM (n = 4) and analyzed by ordinary one-way ANOVA with Sidak’s multiple comparisons test. *P ≤ 0.05, **P ≤ 0.01, ***P ≤ 0.001, ****P ≤ 0.0001. Differential expression of relevant Toll-Like Receptor (TLR) genes in AML cells and MDM are shown in (L) TLR1), (M) TLR2, (N) TLR4, and (O) TLR9. n = 4. Each dot indicates an individual donor. Data are expressed as mean ± SEM and analyzed by unpaired Student’s t-test ***P ≤ 0.001.

