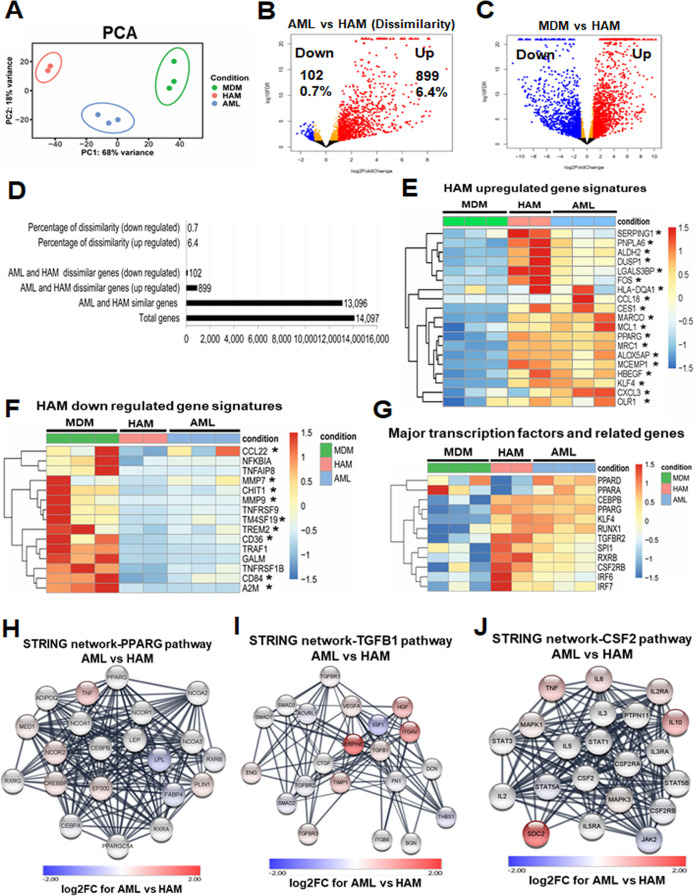
Fig 4.
HAM and AML cells share similar transcriptional profiles and related pathways. (A) Principal component analysis (PCA) demonstrates minimal variation within the biological replicates (HAM: n = 2 donors; AML: n = 3 donors; MDM: n = 3 donors). (B) Volcano plot demonstrates the comparison between the AML and HAM transcriptome. AML and HAM are similar: out of 14,097 expressed genes, only 899 genes are upregulated ≥ two-fold with FDR-adjusted P-value <0.05 (red), and 102 genes are downregulated (blue) in AML cells. (C) Volcano plot demonstrates the comparison between MDM and HAM transcriptome. MDM and HAM are more dissimilar: out of 14,097 expressed genes, 1,516 are upregulated (red) and 1,319 are downregulated (blue) in MDM. (D) Bar graph represents the comparison between the AML and HAM transcriptome. (E and F) Heatmaps showing major up- and downregulated genes in MDM, HAM, and AML cells. The asterisks indicate genes that are listed in Table 1. (G) Heatmap indicates the major transcription factors that are important for HAM development and function, with similar patterns in AML cells and HAM. (H–J) STRING protein–protein interaction analysis of three key signaling pathways in HAM (PPAR-γ, TGFB1, and CSF2). Most of the interacting proteins in these pathways are shown in white, indicating that they have similar expression levels in HAM and AML cells.

