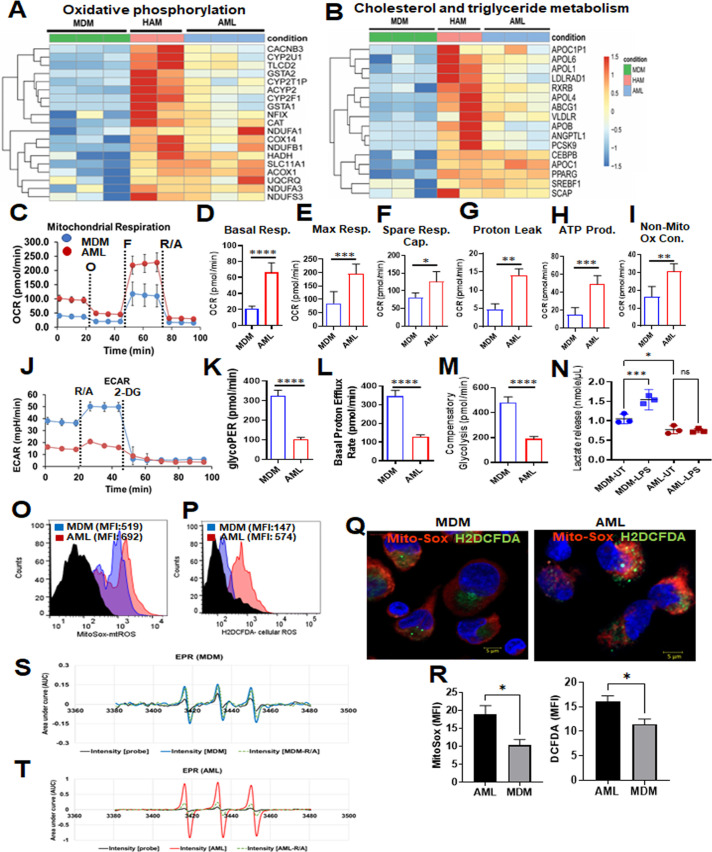
Fig 5.
Metabolic status of AML cells, HAM, and MDM. (A) Heatmap from the RNA-seq data indicates higher relative expression of genes related to fatty acid oxidation and OxPhos in AML cells and HAM. (B) Heatmap from the RNA-seq data indicates that cholesterol and triglyceride metabolism–related genes have a similar expression pattern in HAM and AML cells. (C–M) Red bars and lines represent AML cells, and blue bars and lines represent MDM. Extracellular flux analysis was performed in AML cells and MDM cells by Seahorse analyzer. The oxygen consumption rate (OCR) and extracellular acidification rate (ECAR) were analyzed under basal conditions and in response to Mito Stress Test reagent. (C) The dashed lines indicate when O: oligomycin; F: FCCP; R/A: rotenone and antimycin A were added. (D–F) Representative Mito Stress Test kinetic graphs show higher levels of basal, maximal OCR and higher Spare respiratory capacity (SRC) in AML cells compared to MDM. (G–I) Proton leak, non-mitochondrial OCR and ATP production were also higher in AML cells. (J) The glycolytic rate (ECAR) kinetics graph demonstrates an increase in the glycolytic rate in MDM as compared to AML cells. 2-Deoxy-D-glucose (2-DG) was used to inhibit glycolysis. (K–M) Quantification of basal and compensatory glycolysis in MDM and AML cells. Representative experiment is shown of n = 3, mean ± SD and analyzed by unpaired Student’s t-test *P ≤ 0.05, **P ≤ 0.01, ***P ≤ 0.001, ****P ≤ 0.0001. (N) Lactate levels (nmol/µL) in the culture supernatant of MDM and AML cells after 24-hour LPS treatment (MDM: 10 ng/mL and AML: 100 ng/mL) were measured by Lactate Colorimetric Assay Kit II. Each dot represents an individual donor (n = 3), mean ± SEM and analyzed with one-way ANOVA. *P ≤ 0.05, ***P ≤ 0.001. (O–Q) AML cells and MDM were treated with MitoSOX (5 µM) and DCFDA (5 µM) to demonstrate mitochondrial and cellular ROS (non-mitochondrial), respectively, by flow cytometry and confocal microscopy. Magnification: 63×, scale bar: 5 µM. (R) Bar graphs show mitochondrial and cellular ROS represented as MFI. Representative experiment is shown of n = 3, mean ± SD and analyzed by unpaired Student’s t-test *P ≤ 0.05. (S and T) Electron paramagnetic resonance (EPR) spectrum–based mitochondrial ROS detection in MDM (blue line) and AML cells (red line) probed with Mito-TEMPO-H for signal intensity measurements in cell lysates. The data were analyzed first after baseline correction and subsequently second integration that yielded the area under the curve (AUC) in arbitrary units (AU).

