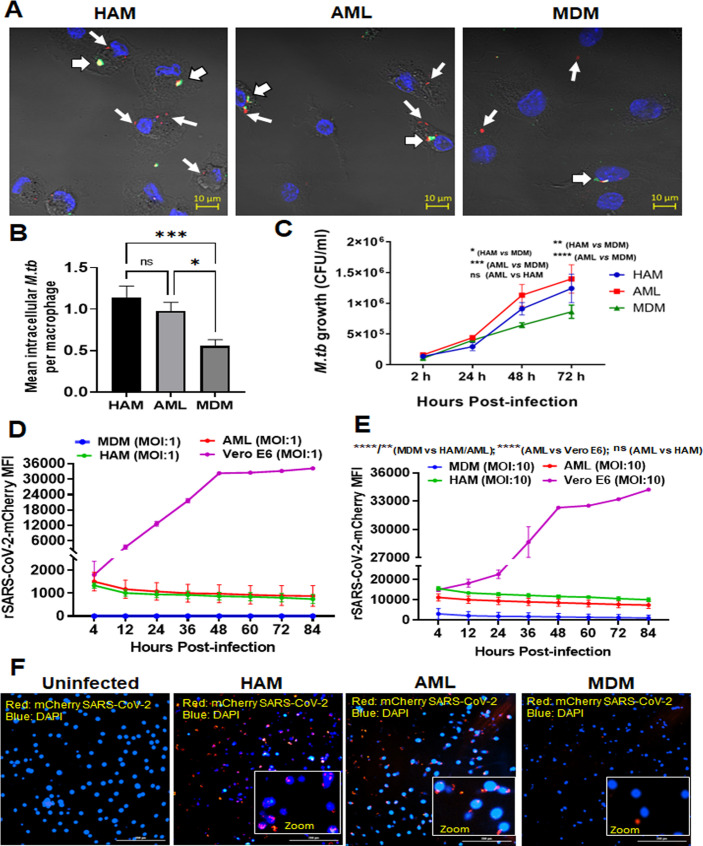
Fig 8.
Uptake and growth of M.tb and SARS-CoV-2 in AML cells are similar to HAM. PBMCs were exposed to ALL cocktail for 6 days on alternative days or left untreated (MDM). Freshly isolated HAMs were obtained from the same donor. Cell monolayers were then incubated with M.tb-H37Rv-mCherry (MOI 5; red) for 2 hours, fixed without permeabilization, and washed. (A) Cell monolayers on coverslips were immunostained with fluorophore-conjugated anti-M.tb antibody (green) and DAPI (blue), and then imaged using confocal microscopy. 63× magnification, scale bar: 10 µm. White arrows indicate mCherry (red) intracellular M.tb, and white arrowheads indicate attached/extracellular (yellow-green) M.tb. (B) Mean number of intracellular bacteria per cell was calculated from >100 macrophages. A representative experiment from MDM/AML cells n = 5, HAM n = 3, mean ± SD. Data were analyzed by ordinary one-way ANOVA. *P ≤ 0.05, ***P ≤ 0.001. (C) Intracellular growth of M.tb-H37Rv was monitored in the indicated time points post-infection (2, 24, 48, and 72 hours) by CFUs. Each point is the mean of CFU values from triplicate wells. Representative experiment of n = 5, mean ± SD with two-way ANOVA. *P ≤ 0.05, **P ≤ 0.01; ***P ≤ 0.001; ****P < 0.0001. (D and E) Kinetics of increased uptake of SARS-CoV-2 (MOI: 1 and 10) and persistence over time using the Cytation 5 live cell imaging system. Data were normalized to uninfected control and presented as mCherry MFI values. Data are expressed as mean ± SD with one-way ANOVA. **P ≤ 0.01; ****P < 0.0001. (F) Representative image of mCherry-positive cells infected with SARS-CoV-2/mCherry-Nluc, counterstained with DAPI at day 5 post-infection. Red: mCherry SARS-CoV-2, blue: DAPI (nucleus). Scale bar: 200 µm and 20× magnification. Inset photomicrographs show higher power images of cells infected with rSARS-CoV-2/mCherry-Nluc (red). The data in D–F are representative of four experiments using different MDM/AML donors and a HAM donor. Videos of cells infected with rSARS-CoV-2/mCherry-Nluc using Cytation 5 live cell imaging 4–84 hours post-infection are shown in Movies S1–S4.

