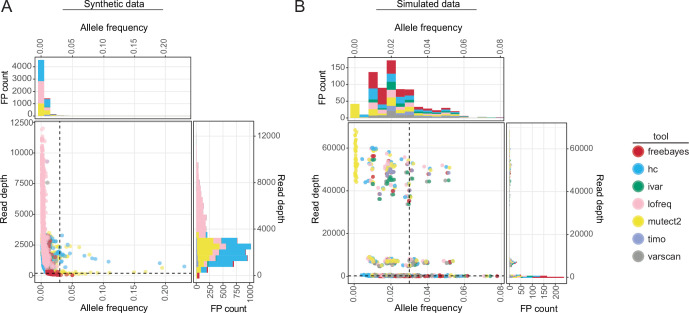
Fig 2.
The output frequency and coverage of false-positive variants in synthetic and simulated data. (A and B) Scatter plots and associated histograms showing the number of false-positive SNVs identified at different output allele frequencies and total read depths for all callers and copy numbers (103–106) in the synthetic influenza A virus samples (A) or across all callers, viruses, and downsampling fractions in simulated data (B). Dotted lines are drawn at allele frequency = 0.03 and read depth = 200×. Color represents the variant caller used.

