Fig 12.
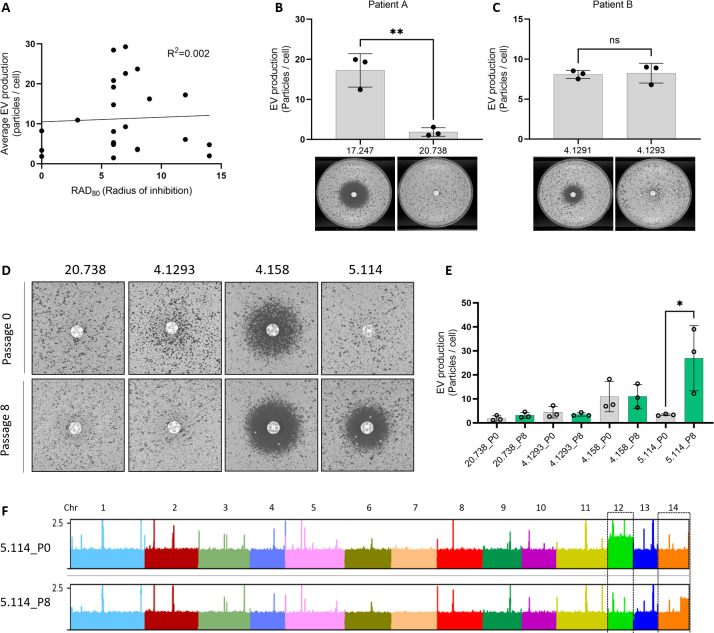
EV production and FLC resistance are linked in clinical isolates. Analysis of EV production by nanoFCM and size of FLC-disk inhibition halo in clinical isolates by linear regression (A, radius of inhibition=RAD80 values by diskImageR). EV production as measured by nanoFCM in the recurrent isolates CNRMA17.247 and CNRMA20.738 (top) and FLC-disk diffusion assays (bottom) from patient A (B). EV production as measured by nanoFCM in the recurrent isolates CNRMA4.1291 and CNRMA4.1293 (top) and FLC-disk diffusion assays (bottom) from patient B (C). FLC-disk diffusion assay in passaged clinical isolates. The CNRMA20.738 and CNRMA4.1293 passage 0 pictures are details of the ones presented in panels B and C, respectively (D). Analysis of EV production of passaged clinical isolates by nanoFCM (E). Alignment of DNA-Seq reads obtained from P0 and P8 CNRMA5.114 passaged clinical isolates (F). EV and FLC-disk analyses were carried out in at least biological triplicates, and representative results were shown. ns, not significant. *p < 0.05.

