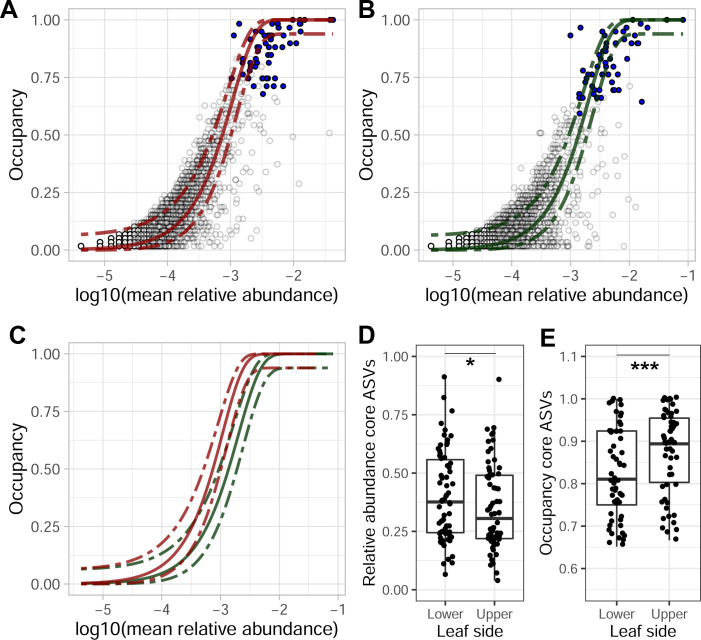
Fig 2.
Occupancy-abundance curves of ASVs in (A) the upper leaf surface samples only and (B) the lower leaf samples only. Each circle represents the observations of an ASV, with the blue dots representing the observations of core ASVs. The lines in each graph represent the neutral model based on the upper samples (red) and lower samples (green), which are directly compared in (C). The (D) relative abundance and (E) occupancy of core ASVs for each of the leaf sides differed significantly (one-sided paired Wilcoxon test) with *P-value < 0.05, **P-value < 0.01, and ***P-value < 0.001.

