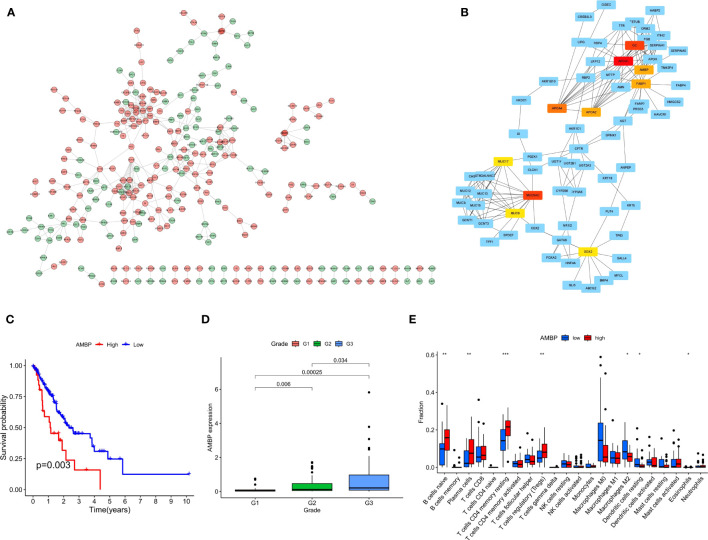
Figure 10.
The PPI network complex for the DEGs and expression levels of hub genes among different clinical characteristics. (A) Proteins encoded by 293 DEGs were used to construct the PPI network. (B) A total of 10 hub genes were identified using Cytoscape. (C) K-M curves based on AMBP level in ECa patients. (D) Box plot of the relationship between the expression of AMBP and different grades. (E) Box plot of the relationship between the expression of AMBP and different immune cells. * P < 0.05, ** P < 0.01, *** P < 0.001.

