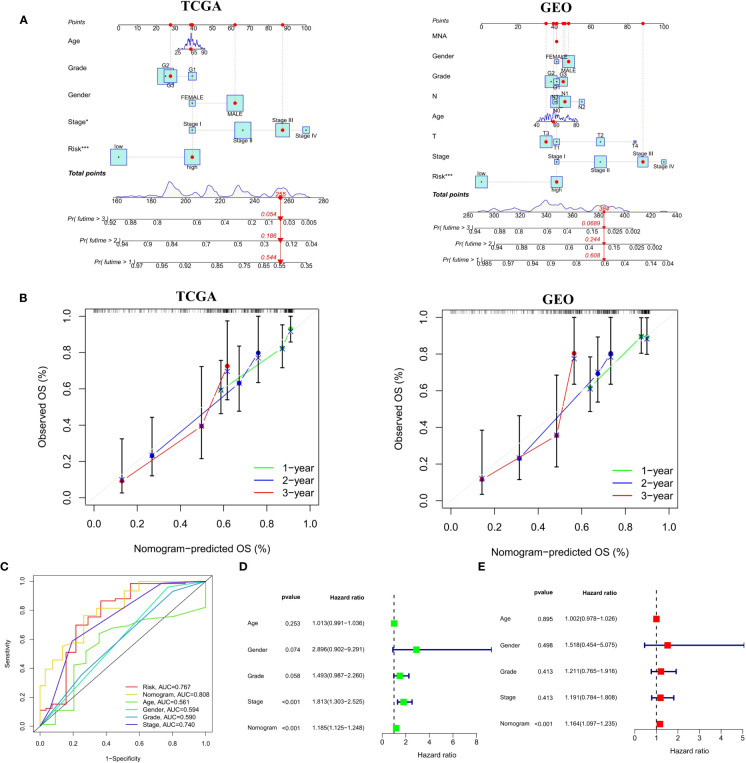
Figure 7.
Construction and verification of a Nomogram. (A) Nomogram for forecasting the 1-, 2-, and 3-year mortality in the TCGA-ECa cohort and GEO-ECa cohort. (B) Calibration curve of the prediction efficiency of Nomogram in TCGA-ECa cohort and GEO-ECa cohort. (C) The AUC value of the nomogram was the highest at 0.808 in the TCGA cohort. (D, E) Univariate and multivariate Cox regression analyses of prognostic factors associated with OS in TCGA cohort, including Nomogram.

