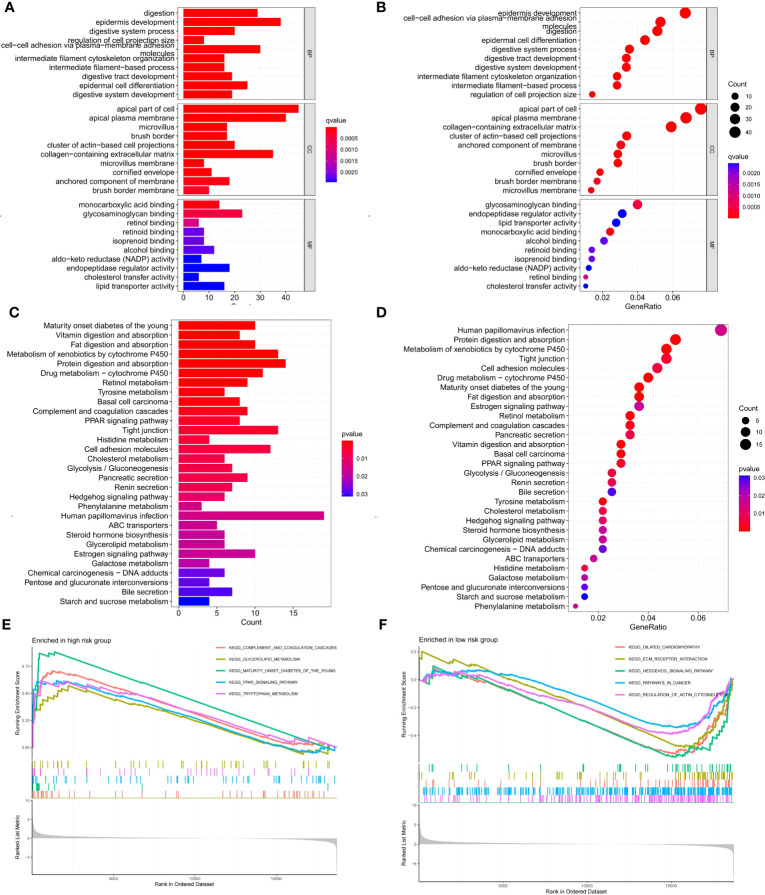
Figure 9.
Enrichment analysis of DEGs between two risk groups and GSEA analysis of 6 signature genes in high- and low-risk groups. (A, B) GO enrichment analysis of DEGs between two risk groups. (C, D) KEGG enrichment analysis of DEGs between two risk groups. (E, F) GSEA analysis of the top five pathways enriched by 6 signature genes in high- and low-risk groups.

