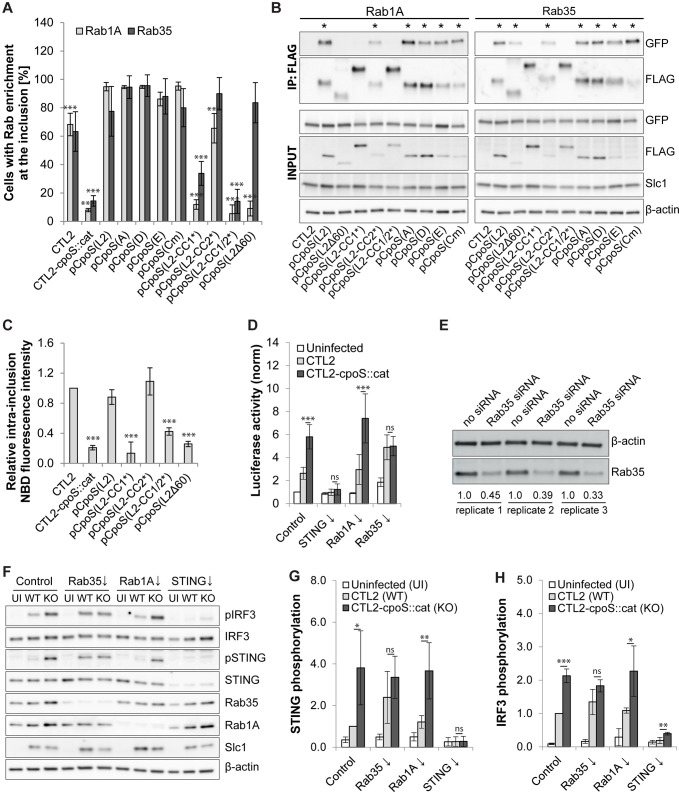
Fig 6.
Rab35 participates in the CpoS-mediated blockade of the IFN response. (A) Enrichment of EGFP-tagged Rab1A and Rab35 at inclusions (2.5 IFU/cell, 24 hpi). BFA (3 µg/mL) was added at 18 hpi [mean ± SD, n = 3 (at least 75 cells per condition), one-way ANOVA: significant differences compared to pCpoS(L2)]. (B) Co-IP reveals the differential ability of CpoS variants to interact with EGFP-Rab proteins. CpoS-FLAG variants were precipitated from lysates of infected HeLa cells (5 IFU/cell, 26 hpi). Eluates were analyzed by western blot analysis (* indicates visible Co-IP of EGFP-tagged Rab proteins). (C) Differential ability of CpoS variants to restore ceramide acquisition. At 14 hpi, infected HeLa cells (5 IFU/cell) were treated with NBD C6-ceramide. At 21 hpi, the average intra-inclusion NBD fluorescence intensity was determined and is displayed relative to the average intensity observed in CTL2 inclusions (mean ± SD, n = 3, one-way ANOVA: significant differences compared to CTL2). (D) Effect of siRNA-mediated Rab protein depletion on the inhibition of the IFN response in infected A2EN-ISRE reporter cells. Cells were infected (10 IFU/cell, purified EBs) at 32 hours post-transfection and analyzed at 14 hpi. Displayed are normalized luciferase activities (mean ± SD, n = 7, one-way ANOVA). Note, data for an extended set of Rab proteins are displayed in Fig. S7B and C. (E) Western blot analysis confirming the depletion of Rab35 in A2EN cells treated with Rab35-specific siRNAs. Protein samples were generated at 46 hours post-transfection in three independent replicates. Relative Rab35 expression levels are indicated below the bands. (F–H) The effect of siRNA-mediated Rab35 depletion on STING and IRF3 phosphorylation in infected cells. A2EN cells were infected [5 IFU/cell, purified EBs; UI, uninfected; WT, wild type (CTL2); KO, knockout (CTL2-cpoS::cat)] at 36 hours post-transfection, and protein samples were generated at 14 hpi. Shown are western blot images from one representative replicate (F) and graphs displaying STING (G) and IRF3 (H) phosphorylation levels relative to those observed in control cells infected with CTL2 (mean ± SD, n = 3, one-way ANOVA).

