Fig 3.

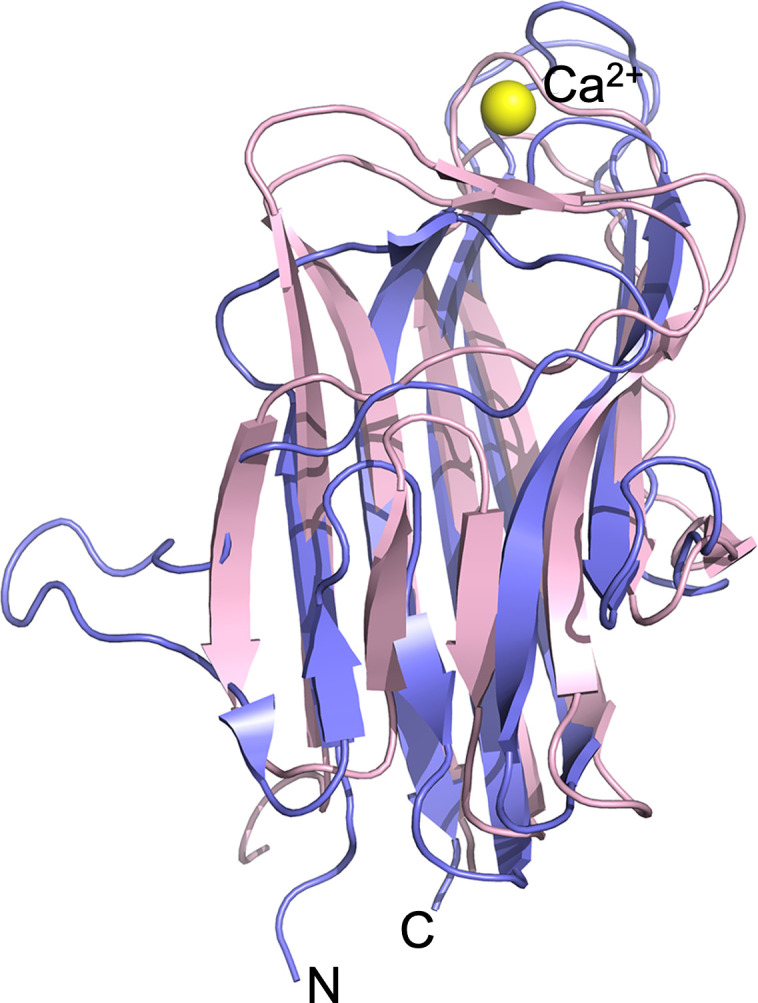
Overlay of BxpB (purple) and BclA CTD (pink) monomeric crystal structures. The Ca2+ ion bound to BxpB (yellow sphere) is shown, and the N and C termini of each protein are at the bottom of the image.

Overlay of BxpB (purple) and BclA CTD (pink) monomeric crystal structures. The Ca2+ ion bound to BxpB (yellow sphere) is shown, and the N and C termini of each protein are at the bottom of the image.