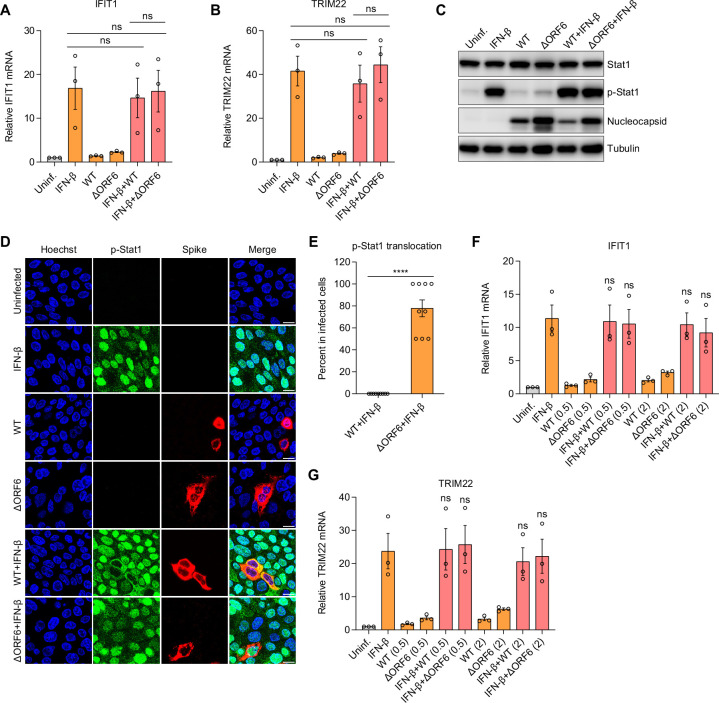
Fig 5.
ORF6 attenuates IFN-stimulated Stat1 translocation but does not impact ISG production. (A and B) Calu-3 cells were infected with SARS-CoV-2 WT virus or ΔORF6 virus (MOI of 0.5) for 24 h. Cells were subsequently treated with IFN-β for 8 h as indicated. Induction of IFIT1 (A) and TRIM22 (B) was examined by RT-qPCR. Gene expression was normalized to uninfected cells. Shown is the mean ± SEM for three independent experiments. The significance was calculated using Kruskal-Wallis test (ns, not significant). (C–E) Calu-3 cells were infected with SARS-CoV-2 WT virus or ΔORF6 virus (MOI of 0.5). At 24 hpi, cells were treated with IFN-β for 0.5 h as indicated. (C) Cells were lysed, and the expression of total and phosphorylated STAT1 (p-Stat1) was determined by immunoblotting. Shown are the representative blots of two independent experiments. (D) Cells were fixed and stained with antibodies against p-Stat1 and SARS-CoV-2 Spike. Representative images of two independent experiments are shown. (E) Percent of p-Stat1 translocation in SARS-CoV-2 infected cells in panel D was determined. Shown is the average percent for nine fields of view from three independent experiments. Significance was calculated using an unpaired, two-tailed Student’s t test (****P < 0.0001). (F and G) Calu-3 cells were infected with SARS-CoV-2 WT virus or ΔORF6 virus with two MOI (0.5 and 2) for 24 h, followed by treatment of IFN-β for 8 h as indicated. mRNA expression of IFIT1 (F) and TRIM22 (G) was analyzed by RT-qPCR. Shown is the mean ± SEM for three independent experiments. The significance was calculated using Kruskal-Wallis test (ns, not significant).

