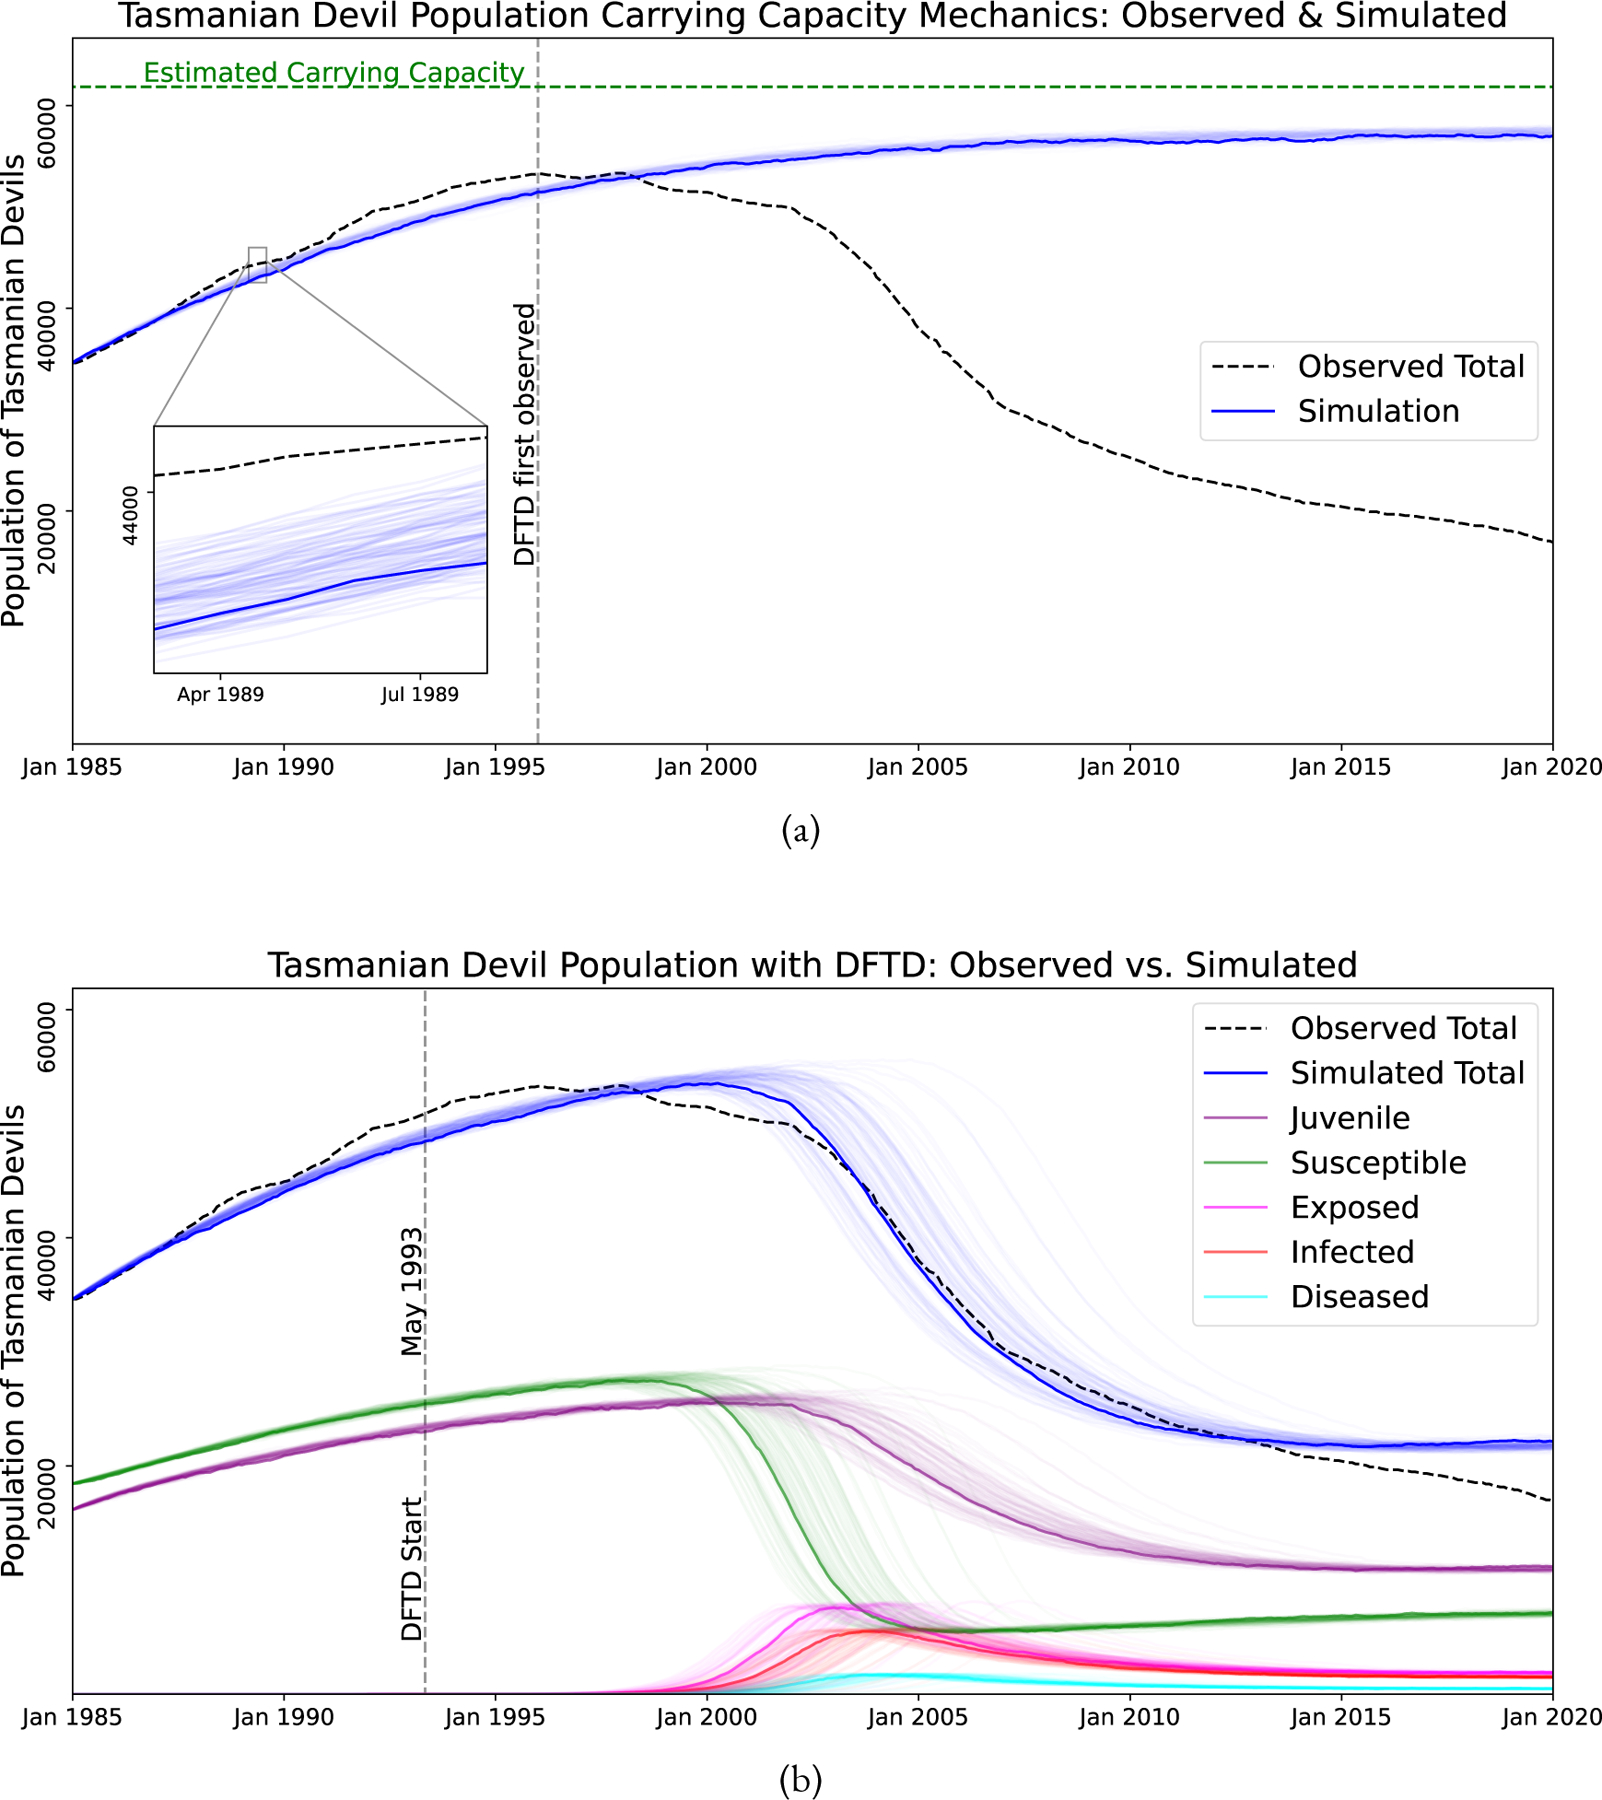
Figure 3:

Simulations of 100 stochastic trajectories of the Tasmanian Devil population model. The first trajectory is dark, while the rest are lighter. The dashed black line represents observed Tasmanian Devil populations (Cunningham et al., 2021). (a) Simulation of the model had DFTD not existed: simulated total population (blue lines) and observed (dashed black line). (b) Simulation of model with DFTD: simulated total population (blue lines), simulated sub-groups (colored lines), and observed (dashed black line).
