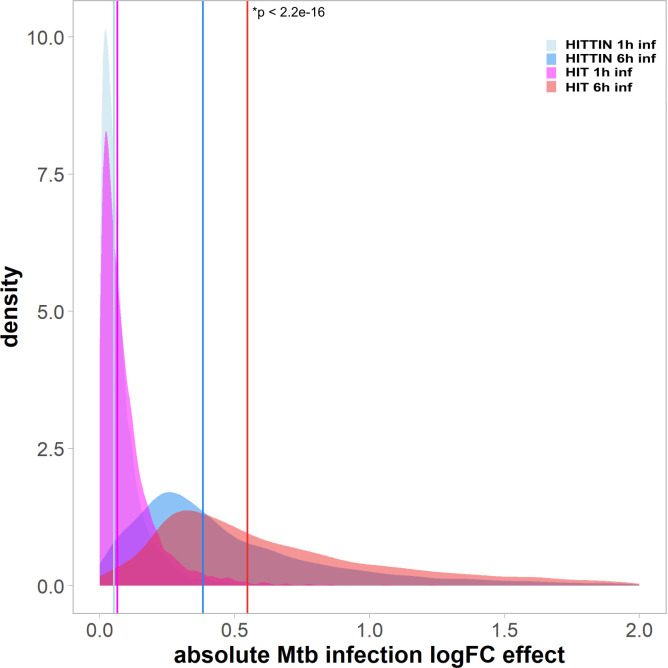
Fig 2. The absolute log fold change Mtb infection effect at 1 and 6 h for PMNHITTIN and PMNHIT.
The density plot shows the absolute log fold change (logFC) Mtb infection effect of each group at 1h and 6h. All DEGs from Fig 1 had their logFC converted to absolute values and plotted using density function. Absolute values for neutrophil DEGs from HITTIN participants are shown in light blue at 1h (median = 0.051) and a darker blue at 6h (median = 0.383). Absolute values for neutrophil DEGs from HIT participants are shown in magenta at 1h (median = 0.065) and red at 6h (median = 0.550). Vertical coloured lines indicate the median of absolute values. PMNHITTIN show a significantly lower logFC response to Mtb infection at 6h (p < 2.2e-16, Wilcoxon rank sum test) compared to 1h of infection with Mtb (p = 0.8255, Wilcoxon rank sum test).

