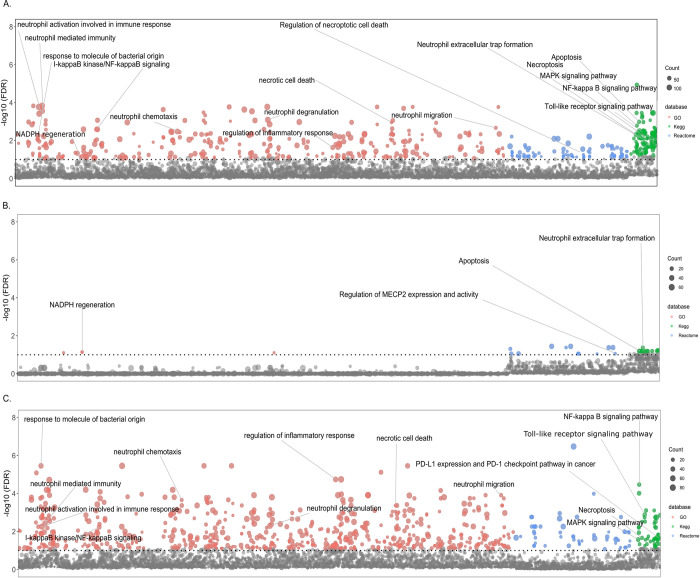
Fig 3. Manhattan plot for enrichment tests of GO terms and Kegg and Reactome pathways.
The Manhattan plot shows pathways and GO terms for the DEGs triggered significantly differentially by Mtb in neutrophils from HITTIN versus neutrophils from HIT participants after 6h of infection. The tested terms are distributed along the x-axis. The y-axis represents the negative log 10 false discovery rate (FDR) result with the horizontal dotted line indicating the 10% FDR significance cut-off. Grey dots represent terms not meeting the significance threshold. Coloured dots represent significant terms from GO (red), Kegg (green) and Reactome (blue). The number of DEGs in each term is represented by the scaled size of the dot. Panel (A) shows the terms detected by all significantly different DEGs in the HITTIN vs HIT contrast. Panel (B) shows significant terms which are driven by genes with significant positive FC/less downregulated by PMN from HITTIN participants while panel (C) displays terms for genes significantly less upregulated for PMN from HITTIN participants as compared to PMNHIT after 6h of Mtb infection.

