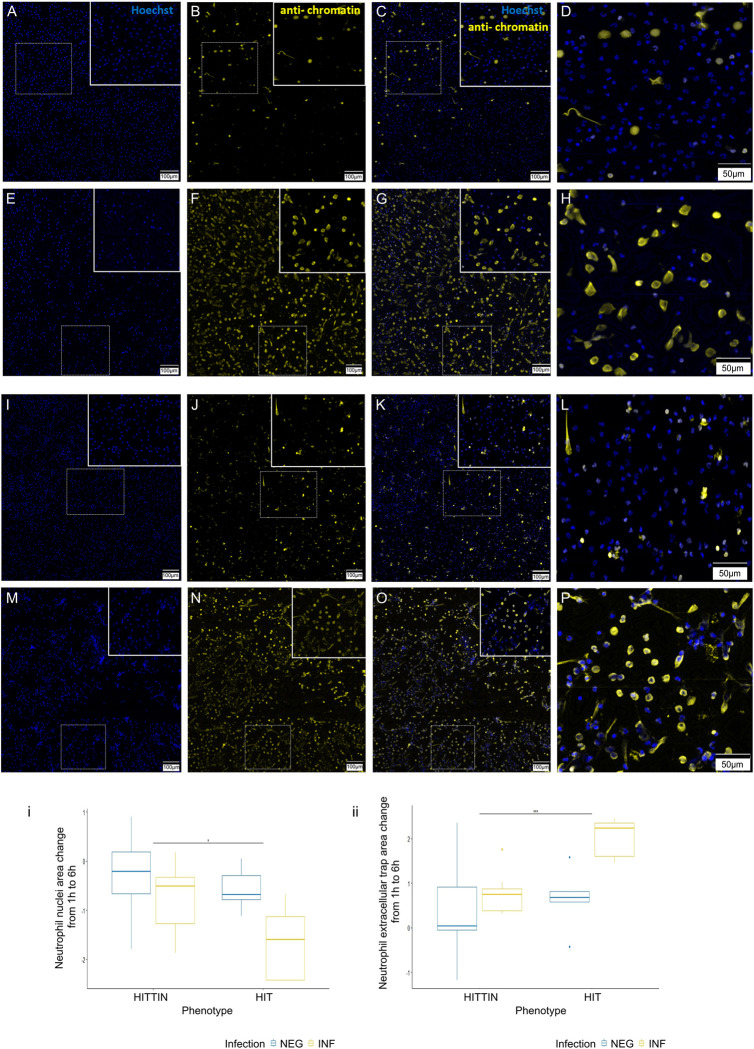
Fig 4. Representative images and quantification of the change in NET and nuclei area following Mtb infection of neutrophils from HITTIN and HIT.
PMNHTTIN (A-H) and PMNHIT (I-P) following Mtb infection for 1h (A-D and I-L) and 6h (E-H and M-P). Mtb infected neutrophils at 1h and 6h were stained with Hoechst 33342 (A, E, I, M) and PL2-3 (B, F, J, N). Overlap between the two stains is shown in (C, G, K, O) with enlarged box panels in (D, H, L, P; blue, DNA; yellow, chromatin); (i) Boxplots for total log change in nuclei area (Hoescht stain, calculated as shown in S1 Fig) from 1h to 6h uninfected and infected with Mtb in HITTIN vs HIT. There was a significant Mtb infection effect, F(1,12) = 9.729, p = 0.009 with pairwise comparisons showing a significant difference between the total change in cell nuclei area from 1h to 6h after Mtb infection in HITTIN compared to HIT (p = 0.04*, pairwise t-test), (ii) Boxplots for total log change in NET area (corrected for by the change in cell nuclei area, calculated as shown in S1 Fig) (PL2-3 anti-chromatin stain) from 1h to 6h uninfected and infected with Mtb in HITTIN vs HIT. There was a significant Mtb infection effect, F(1, 10.5924) = 5.3398, p < 0.0421 with pairwise comparisons showing a significantly difference between the total changed in cell nuclei area from 1h to 6h after Mtb infection in HITTIN compared to HIT (p = 0.0003***, pairwise t-test). The scale bars represent 100 μm (A-C, E-G, I-K, M-O) and 50 μm (D, H, L, P).

