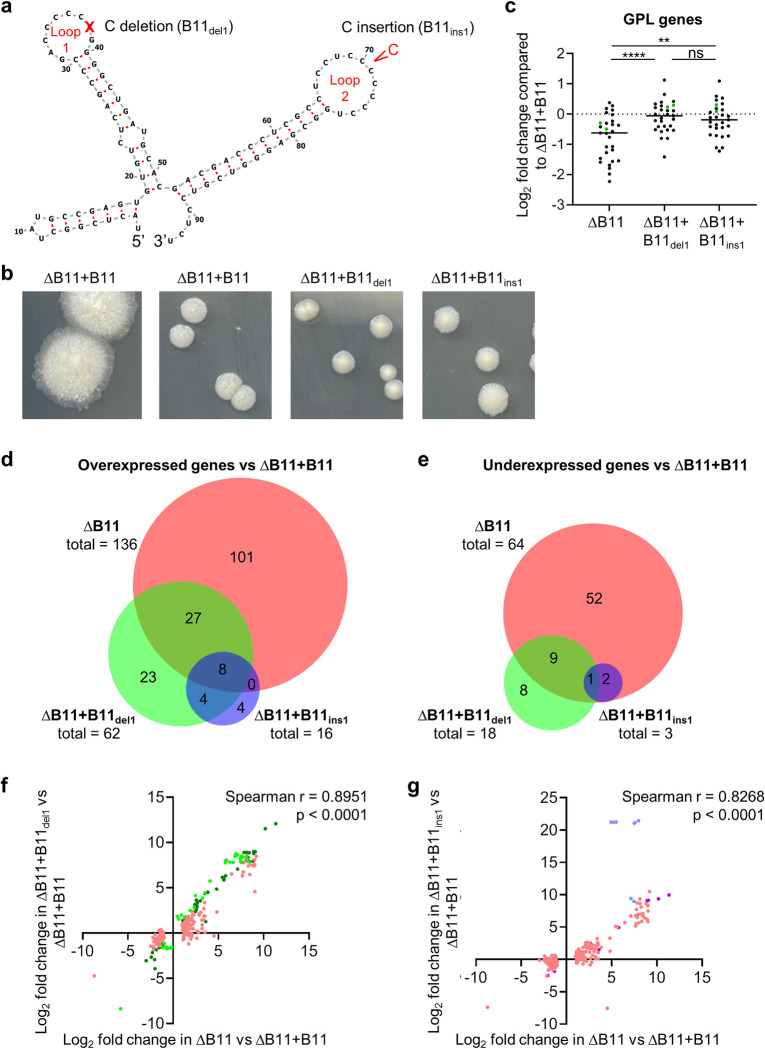
Fig 6. B11 mutations found in clinical M. abscessus strains cause partial loss of function.
A. Deletion of one C from loop 1 was found in one clinical isolate, while insertion of one C into loop 2 was found in 3 clinical isolates. B. Smooth morphology was largely restored upon complementation of the ΔB11 strain with B11 harboring each of the two clinical loop mutations. C. RNAseq revealed that genes involved in GPL synthesis and transport had reduced expression in the ΔB11 strain and this was largely complemented by each of the clinical loop mutations. Each dot represents a gene associated with GPL metabolism (62). mps1 and mps2 are indicated with green dots. ** P < 0.01, **** P < 0.0001, one way RM ANOVA. D-E. Intersections of genes differentially expressed (log2 fold change > 1 or < -1, P < 0.05) in ΔB11/ΔB11+B11, ΔB11+B11del1/ΔB11+B11, and ΔB11+B11ins1/ΔB11+B11. Venn diagrams were created with BioVenn (101). P < 0.0001 for the overlaps between between all pairs of comparisons, hypergeometric test. F. There is a correlation between log2 fold change in genes differentially expressed in ΔB11/ΔB11+B11 and/or in ΔB11+B11del1/ΔB11+B11. Dark green dots represent genes differentially expressed in both comparisons. Pink dots represent genes that met the criteria for differential expression in ΔB11/ΔB11+B11 but not in ΔB11+B11del1/ΔB11+B11. Light green dots represent genes that met the criteria for differential expression in ΔB11+B11del1/ΔB11+B11 but not in ΔB11/ΔB11+B11. G. There is a correlation between log2 fold change in genes differentially expressed in ΔB11/ΔB11+B11 and/or in ΔB11+B11ins1/ΔB11+B11. Magenta green dots represent genes differentially expressed in both comparisons. Pink dots represent genes that met the criteria for differential expression in ΔB11/ΔB11+B11 but not in ΔB11+B11ins1/ΔB11+B11. Periwinkle dots represent genes that met the criteria for differential expression in ΔB11+B11ins1/ΔB11+B11 but not in ΔB11/ΔB11+B11.

