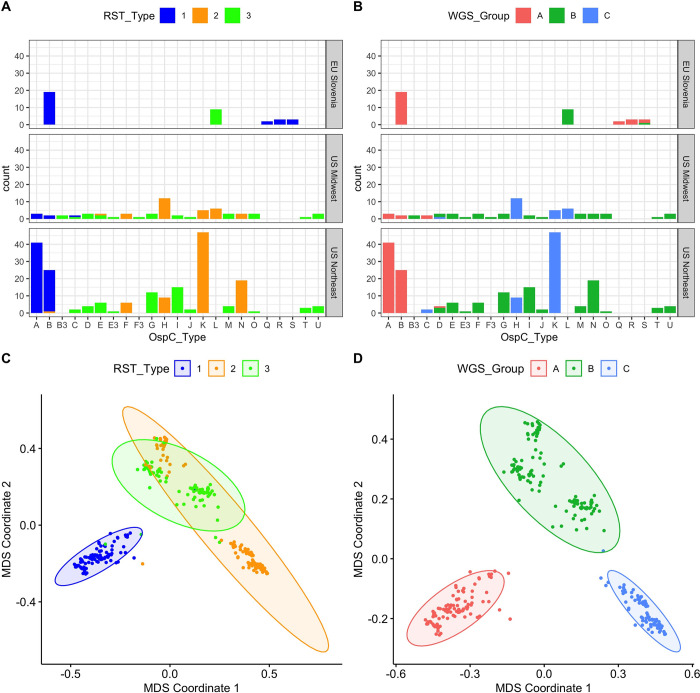
Fig 1.
A. Counts of samples according to RST and OspC type. Top, middle, and lower panels show samples from different geographic regions. X-axis gives OspC type. Bars are colored according to RST type. B. Plots as in (A) but with bars colored according to the WGS group. C. Multidimensional scaling (MDS) of 299 Bb genomes, with RST type annotated. D. MDS of 299 Bb genomes, with WGS type annotated.

