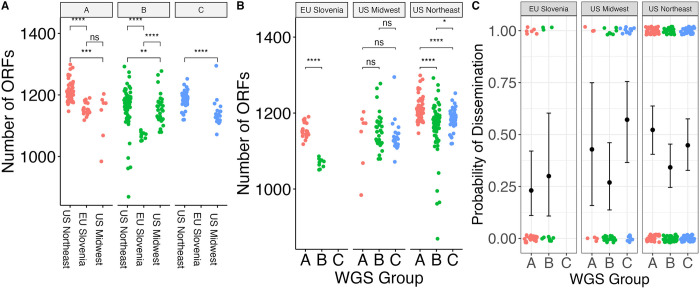
Fig 3.
A. Number of ORFs by geographic region in different WGS groups. * denotes p < 0.05; ** denotes p < 0.01; *** denotes p < 0.001; **** denotes p < 0.0001; ns—not significant (as assessed by Wilcoxon rank-sum test). B. Number of ORFs by WGS group in different geographic regions, with assessment of statistical significance as in (A). C. Probability of dissemination by genomic group. Each point represents a sample. Points are colored by WGS group. The samples that disseminated have been plotted at y = 1; those that did not have been plotted at y = 0. Random noise has been added to the x- and y- coordinate to display the points. The mean +/- 95% binomial confidence interval is shown for each group with error bars.

