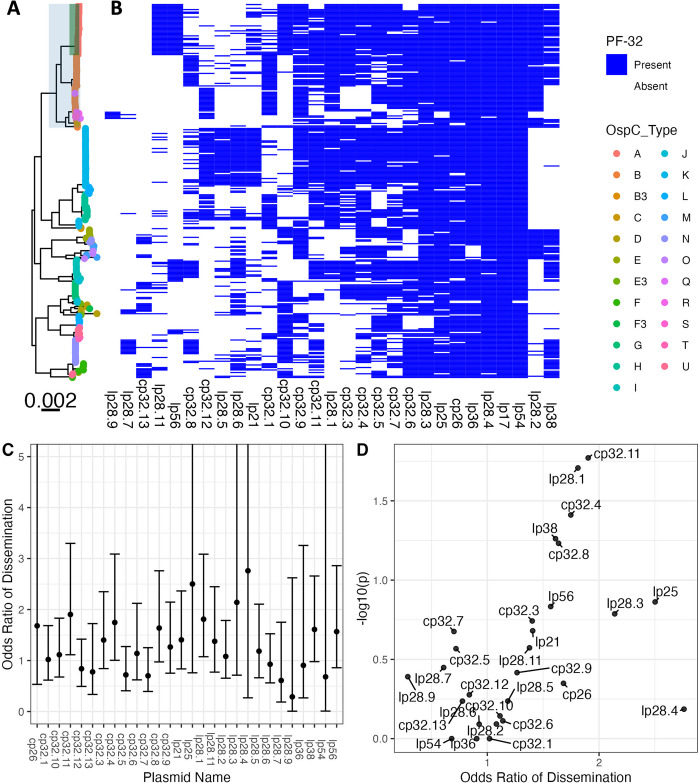
Fig 4.
A. Core genome maximum likelihood phylogeny with tips colored by OspC type. The clade corresponding to RST1 is shaded in light blue and the clade corresponding to OspC type A is shaded in green. B. The matrix at the right shows the presence or absence of individual plasmids using the presence or absence of PFam32 plasmid-compatibility genes as a proxy. The columns of the matrix have been clustered using hierarchical clustering. The rows of the matrix are ordered according to the midpoint rooted maximum likelihood phylogeny shown at left. C. Odds ratio of dissemination and confidence interval by plasmid, inferred by PFam32 sequences. D. Volcano plot displaying the -log10 P value (as calculated using Fisher’s exact test) and the odds ratio of dissemination for each plasmid, inferred by Pfam32 sequences.

