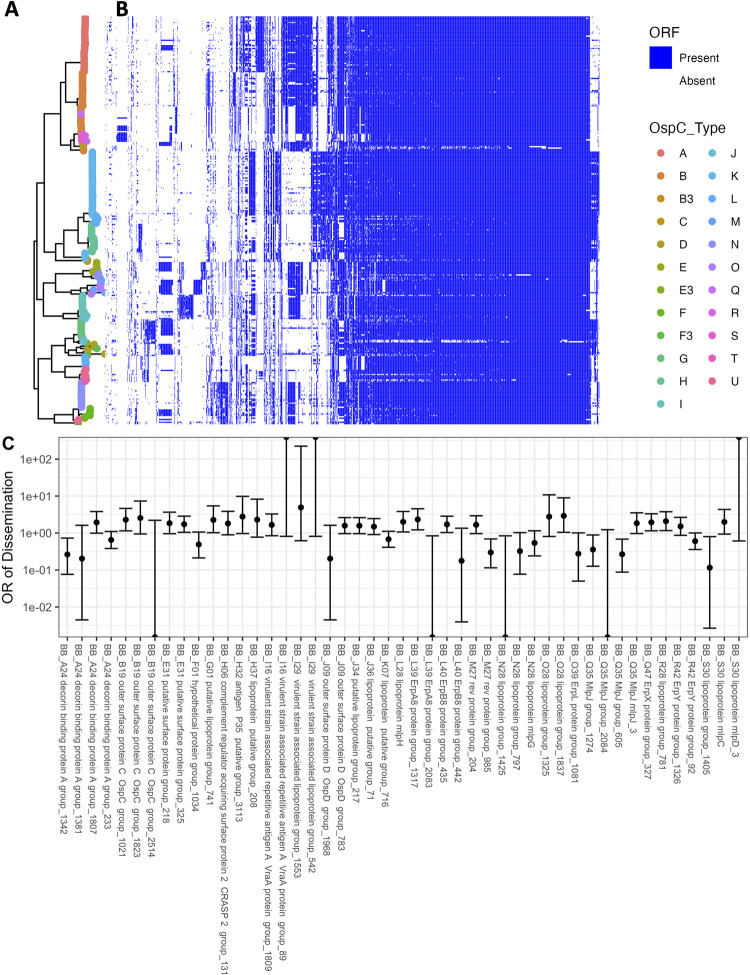
Fig 5.
A. Core genome phylogeny with tips colored by OspC type. B. The phylogeny is plotted alongside a matrix of presence (blue) or absence (white) for genes in the accessory genome. The rows of the matrix are ordered by the phylogenetic tree in A. The columns of the matrix are ordered using hierarchical clustering such that genes with similar patterns of presence/absence across the sequenced isolates are grouped close together. C. Odds ratio (OR) of dissemination and 95% confidence interval for homology groups encoding surface-exposed lipoproteins and for which the unadjusted p-value for association with dissemination (by Fisher’s exact test) is < 0.15.

