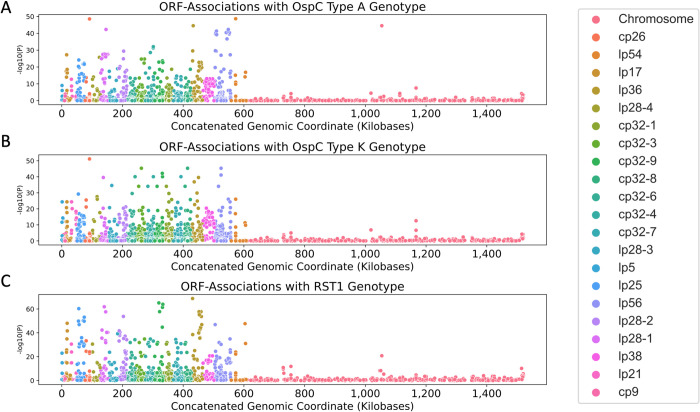
Fig 8.
Manhattan Plots showing the association of individual ORF homologous groups with OspC type A (panel A), Osp C type K (panel B), and RST1 (panel C). The Y axis plots the P-value for tests of association between each homology group and the lineage marker as shown. For ORFs that aligned to the B31 reference genome, the x axis denotes the annotated position in the genome.

