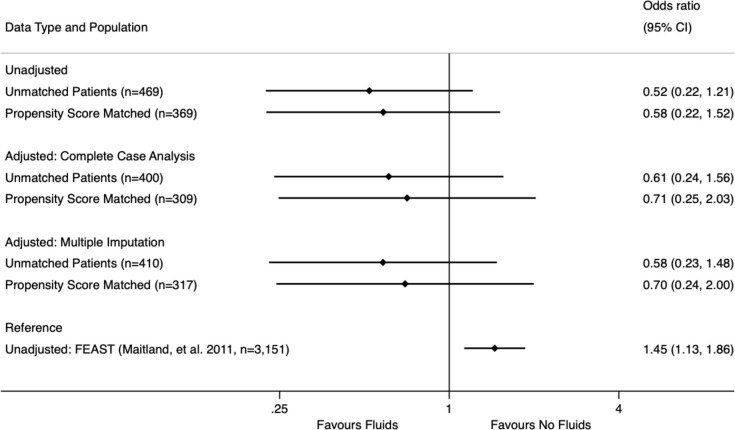
Fig 3. Subgroup mortality analysis for patients meeting FEAST inclusion/exclusion criteria.
Graphical representation of the odds ratios and 95% confidence intervals for the mortality associated with fluid administration in six different groups of patients that meet the inclusion and exclusion criteria for the seminal FEAST trial (Maitland, et al. 2011): unadjusted (univariate) analysis for (1) unmatched and (2) propensity score matched patients; multivariable logistic regression complete case analysis for (3) unmatched and (4) propensity score matched patients; multivariable logistic regression multiple imputation analysis for (5) unmatched and (6) propensity score matched patients. The unadjusted (univariate) analysis from the FEAST trial is included for reference.

