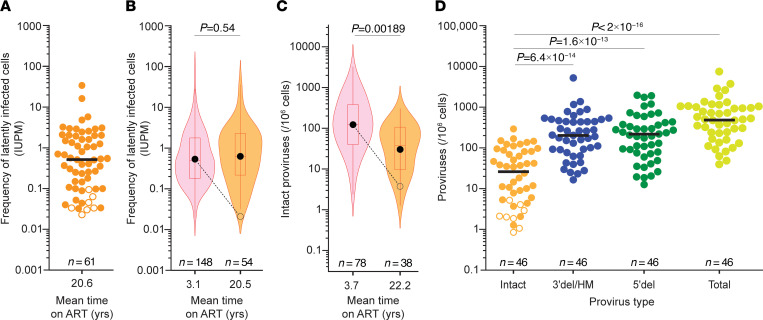
Figure 2. Reservoir measurements in PWH on long-term ART.
(A) QVOA measurements of inducible, replication-competent proviruses among resting CD4+ T cells of PWH on ART for more than 7 years (mean 20.6 years). Virus was isolated in 54 of 61 assays from 42 participants. For negative assays (open symbols), a posterior median estimate is given (88). Black line, median value; n, number of assays. (B) Violin plots of the frequencies of latently infected cells in positive QVOAs on resting CD4+ T cells from 59 PWH on short-term ART (pink) and 38 PWH on long-term ART (orange). Mean duration of suppressive ART at sampling is on the x axis. Boxes and whiskers indicate middle quartiles and maximum and minimum values, respectively. Red horizontal lines, median; black circles, geometric mean. Expected decay with t1/2 = 44.2 months over the relevant time interval is indicated (dashed line). Short-term ART data are from the 2003 study (29). Short- and long-term frequencies were not statistically different (P = 0.54) by Student’s t test on log-transformed values. (C) Violin plots of the frequencies of intact proviruses as measured in positive IPDAs on samples from 62 PWH on short-term ART (pink) and 34 PWH on long-term ART (orange). Short-term ART data are from ref. 35 using samples obtained between 0.5 and 7 years after ART initiation. Expected decay with t1/2 = 44.2 months over the relevant time interval is indicated (dashed line). Log-transformed values were compared using Student’s t test. (D) IPDA measurements of the frequency of intact and defective proviruses (3′ deleted/hypermutated and 5′ deleted) in resting CD4+ T cells of PWH on suppressive ART for more than 7 years (mean = 22.0 years). Bars indicate median values. For negative assays (open symbols), maximum value based on the number of cells plated is shown. Significance values for multiple comparisons with the log-transformed frequencies of intact proviruses were determined using Dunnett’s test. n, number of assays.

