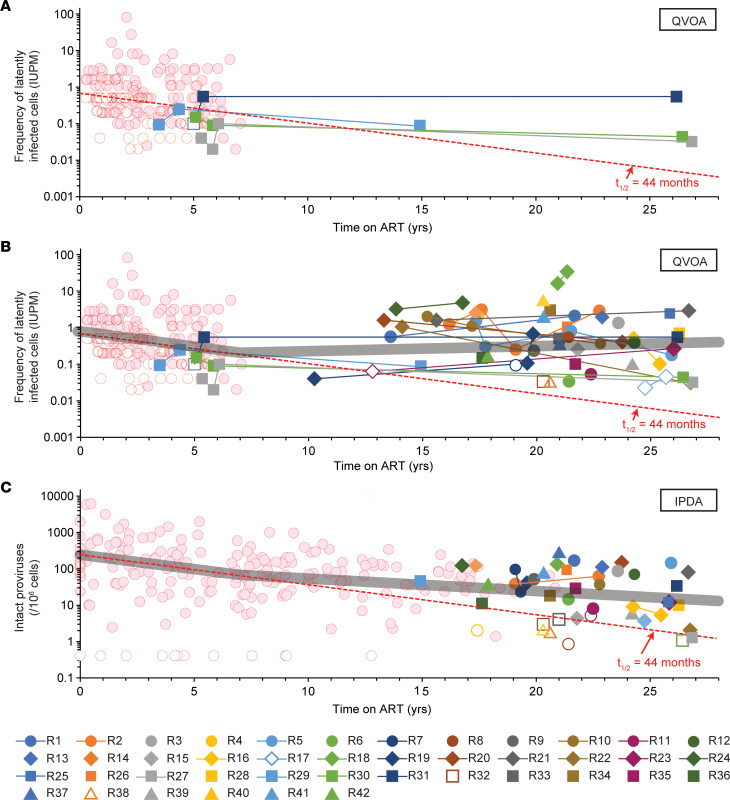
Figure 3. Decay of the latent reservoir during very long-term ART.
(A) QVOA measurements of the frequencies of resting CD4+ T cells with inducible, replication-competent proviruses in 4 PWH from the original 2003 study (29) who were sampled again after a total of 15–27 years on suppressive ART. Frequencies for the first 7 years of ART from other participants in Siliciano et al. (29) are shown by red circles. For assays with no outgrowth, the median posterior estimate of infected-cell frequency based on input cell number was plotted (open symbols). Monophasic decay with t1/2 = 44 months is indicated by the dashed red line. (B) QVOA measurements for all participants in the current study. Lines connect longitudinal measurements in the same donor. A best fit model for segmented exponential decay (thick gray line) shows initial decay with t1/2 = 44 months followed by an inflection at 7 years and then a slow increase (doubling time = 23 years). See Supplemental Table 5 for details. (C) IPDA measurements of the decay of intact proviruses in PWH on very long-term ART. Frequencies for the initial years of ART (red circles) were replotted from Peluso et al. (35). Results are expressed as the DNA shearing index–corrected (DSI-corrected) geometric mean frequency of intact proviruses in resting CD4+ T cells (34). For assays in which no intact proviruses were detected, results are reported as the inverse of the number of cell equivalents analyzed (open symbols). The DSI was below 0.5 for all participants. Monophasic decay with a half-life of 44.2 months is indicated by the dashed line. A model for segmented exponential decay (thick gray line) shows initial decay with t1/2 = 46 months followed by an inflection at 7 years and slower subsequent decay (t1/2 = 9 years). See Supplemental Table 6 for details.

