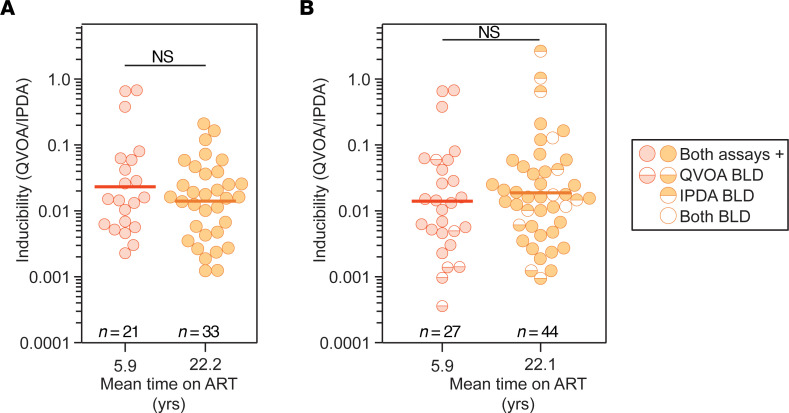
Figure 4. Inducibility of the latent reservoir in PWH on short- and long-term ART.
(A) QVOA/IPDA analysis of inducibility. Inducibility was measured as the ratio of the frequency of inducible, replication-competent proviruses per 106 resting CD4+ T cells over the frequency of intact proviruses per 106 resting CD4+ T cells in the same sample (QVOA/IPDA). Short-term ART data are from a study by Bruner et al. (34). The mean duration of treatment with suppressive ART at the time of sampling is shown for each group on the x axis. The geometric mean values (thick line) and statistical significance (Student’s t test on log-transformed values) are indicated. This analysis was performed using data from samples for which both assays were positive. (B) Data from A together with results from samples for which one of the frequencies was below the limit of detection (BLD). For these samples, frequencies were estimated as described in the legend to Figure 2.

