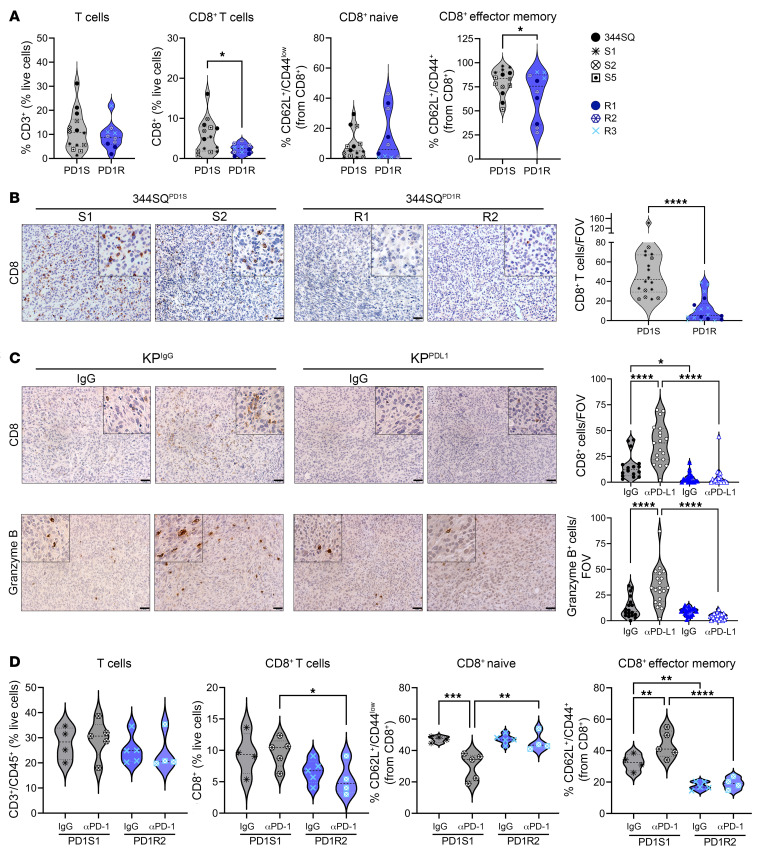
Figure 2. Anti–PD-1–resistant tumor models demonstrate reduced CD8+ T cell and effector functions compared with sensitive tumors.
(A) Three of the 344SQPD1R lines, 3 of the 344SQPD1S lines, and the 344SQ parental line were implanted into WT mice. After 3 weeks, tumors were excised, processed into single cells, and stained for multicolor flow cytometry analysis of immune cell subsets. The total intratumoral T cells were gated as CD3+ as a percentage of total CD45+ cells. Under total T cells, we then analyzed the CD8+ T cells for total amounts and effector memory (CD62L–CD44+) or naive (CD62L+CD44–) status. Individual models are denoted by different symbols and colors. n = 2–5 mice per model. *P < 0.05 by t test. (B) Two representative cell lines for both 344SQPD1S and 344SQPD1R were implanted into WT mice and tumors grown until endpoint (about 6–7 weeks). Tumors were collected and analyzed via IHC for CD8+ T cells. A representative image per model is depicted (left). All tumors per group were combined and graphed as total CD8+ T cells per field of view (FOV) (right). n = 2 mice per cell line, 3–6 images per mouse tumor. ****P < 0.0001 by t test. Scale bars: 50 μm; insets zoomed 200%. (C) The KPIgG and KPPDL1 tumors from Figure 1E were collected for IHC and analyzed for total CD8+ T cells (top) and granzyme B staining (bottom). n = 3 tumors per condition, 5–6 images per tumor. *P < 0.05, ****P < 0.0001 by 1-way ANOVA with multiple comparisons corrected. Scale bars: 50 μm; insets zoomed 200%. (D) 344SQPD1S1 and 344SQPD1R2 models were implanted into WT mice and then treated with either IgG control or anti–PD-1 antibody. After 2 weeks of treatment, tumors were excised and analyzed via multicolor flow as described in A. *P < 0.05, **P < 0.01, ***P < 0.001, ****P < 0.0001.

