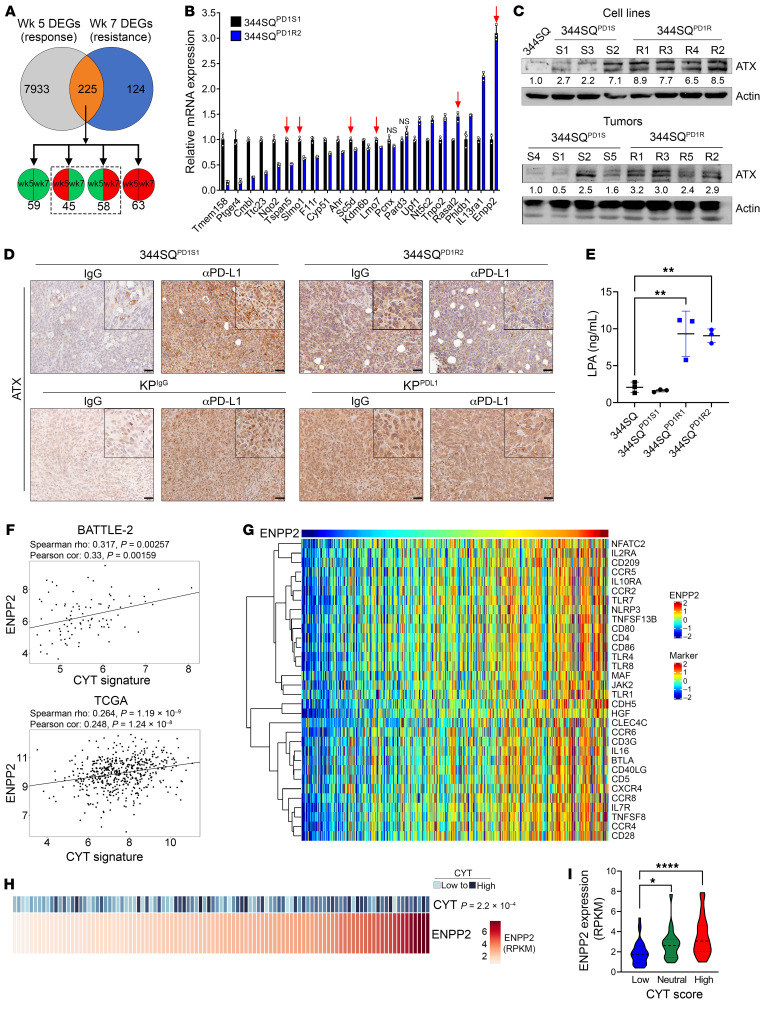
Figure 3. Enpp2/ATX is upregulated with PD-(L)1 resistance in KP murine models and cytolytic gene signature in patients with human lung adenocarcinoma.
(A) Previously published transcriptomics from IgG or anti–PD-L1–treated 344SQ tumors were analyzed at week 5 (response) and week 7 (resistance) (17). DEGs between treatments at each time point (225 total) were analyzed for directionality, and we focused on DEGs that changed in directionality between time points (dashed box). (B) The top DEGs from A were analyzed via quantitative PCR in 344SQPD1S1 and 344SQPD1R2 cells and are graphed relative to 344SQPD1S1. Arrows denote genes changing in the same direction as the microarray. All genes except those marked “NS” are significantly different at P < 0.05, by t test. (C) The 344SQPD1S and 344SQPD1R cells (top) and tumors (bottom) were analyzed via Western blotting for Enpp2/ATX expression. Actin densitometric values were normalized to the corresponding actin band and then to the first lane. (D) Representative ATX IHC images in anti–PD-L1– or IgG-treated 344SQPD1S1 and 344SQPD1R2 (top) or KPIgG and KPPDL1 (bottom) tumors. Scale bars: 50 μm; insets zoomed 200%. (E) Conditioned media from 344SQPD1S and 344SQPD1R models were analyzed for LPA via ELISA. **P < 0.01, by 1-way ANOVA. (F) ENPP2 expression in lung adenocarcinoma patients with lung adenocarcinoma was correlated with a previously described T cell cytolytic score (CYT) (62) in BATTLE-2 (top) and TCGA Firehouse Legacy (bottom) data sets. (G) ENPP2 expression in TCGA Firehouse Legacy samples was correlated with a previously published inflammatory gene signature (33) (rho cutoff, 0.4; FDR, 0.05). (H and I) Analysis of ENPP2 in the MD Anderson ICON data set. (H) Correlation of ENPP2 with the CYT score as described in F. (I) ENPP2 expression was compared across ICON patients grouped as having a low, neutral, or high CYT score. *P < 0.05 and ****P < 0.0001, by Wilcoxon’s rank-sum testing.

