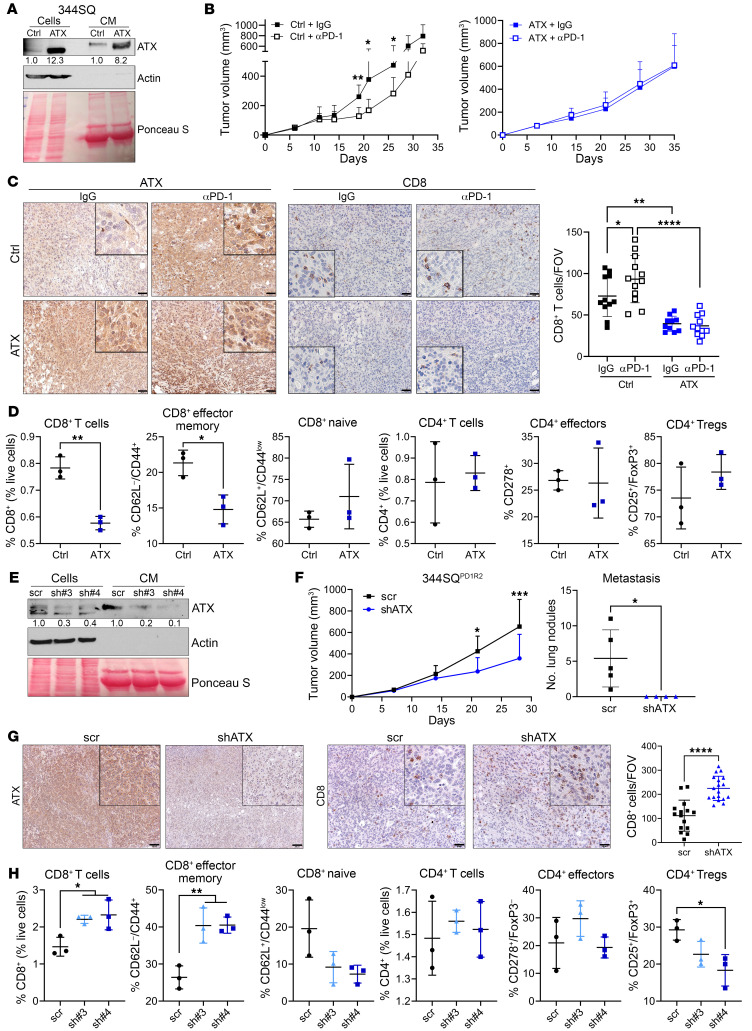
Figure 4. ATX expression negatively correlates with CD8+ T cell infiltration and effector status in tumors.
(A) 344SQ-control (ctrl) or ATX-overexpressing cells were analyzed via Western blotting of cells and conditioned media (CM). ATX densitometric values were normalized to the corresponding actin or Ponceau bands and then to 344SQ-ctrl. (B) Tumor growth was measured from mice implanted with 344SQ-ctrl or -ATX cells and treated with IgG or anti–PD-1. n = 5 mice per group. *P < 0.05 and **P < 0.01, by multiple t tests (per time point). (C) Representative ATX and CD8 IHC images completed on tumors from B. CD8+ T cells were quantified as number per FOV. n = 3 mice each. *P < 0.05, **P < 0.01, and ****P < 0.0001, by 1-way ANOVA. Scale bars: 50 μm; insets zoomed 300% (ATX) or 250% (CD8). (D) 344SQ-ctrl or -ATX cells were cocultured with naive immune cells over time, and immune cell populations were analyzed by flow cytometry. The experiment was completed twice. *P < 0.05 and **P < 0.01, by t test. (E) 344SQPD1R2 cells depleted of ATX using 2 shRNAs or a control (scr) were analyzed as in A. (F) Tumor growth from 344SQPD1R2-scr and shATX#4 cells implanted into mice was monitored via calipers (left). Metastatic lung nodules were quantified at necropsy (right). n = 4–5 mice per group. *P < 0.05 and ***P < 0.001, by multiple t tests (G) Representative ATX and CD8 IHC images completed on tumors from F. n = 2 mice each, 6–9 FOV per tumor. ****P < 0.0001, by t test. Scale bars: 100 μm (ATX), 50 μm (CD8); insets zoomed 200%. (H) The 344SQPD1R2-scr and shATX cells from E were cocultured with naive immune cells as in D. The experiment was completed twice. *P < 0.05, **P < 0.01, and ***P < 0.001, by 1-way ANOVA.

