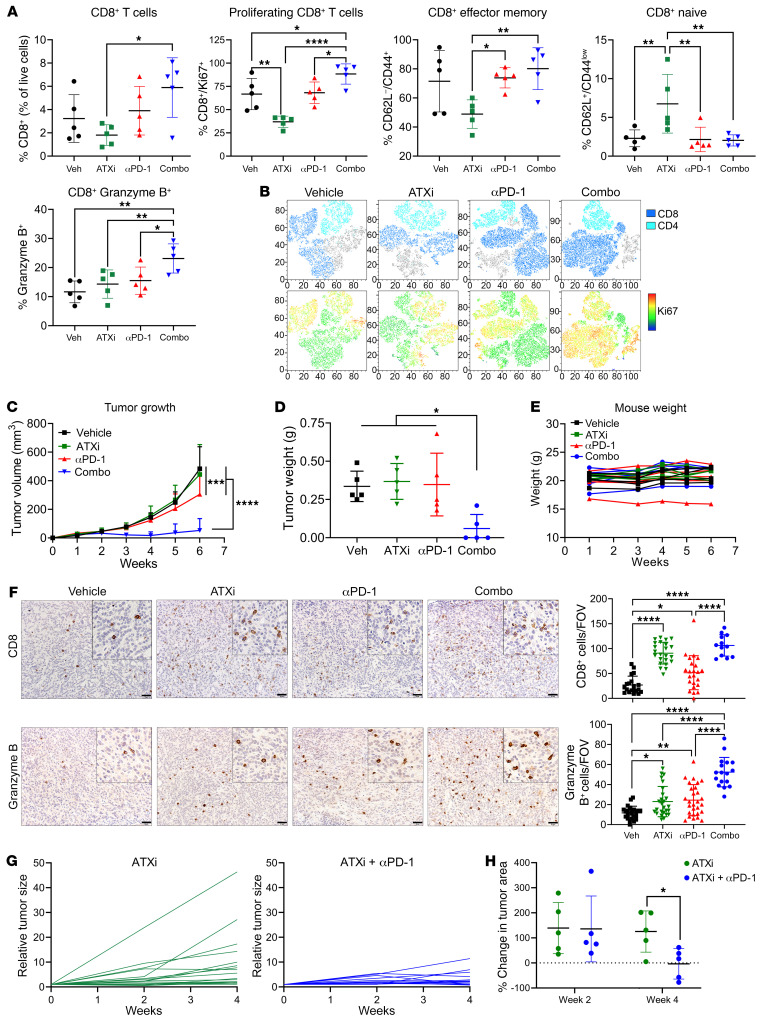
Figure 5. Pharmacological targeting of ATX in combination with PD-1 blockade promotes CD8+ T cell proliferation and activation, effectively controlling tumor growth in vivo.
(A) 344SQ cells were implanted into mice and treated with IgG/vehicle, ATX inhibitor (ATXi), anti–PD-1, or a combination. After 1 week of treatment, tumors were processed for flow cytometry of immune populations. *P < 0.05, **P < 0.01, and ****P < 0.0001, by 1-way ANOVA. (B) Representative t-distributed stochastic neighbor embedding (TSNE) plots of data from A. Total CD3+ (top) and CD3+Ki67+ (bottom) cells are depicted. (C–F) 344SQ cells were implanted into mice and treated as described in A. n = 5 mice per group. (C) Tumor growth was measured via calipers. ***P < 0.001 and ****P < 0.0001, by 2-way ANOVA with Tukey’s correction. (D) Tumor weights were collected at necropsy. *P < 0.05, by 1-way ANOVA with Tukey’s correction. (E) Mouse weights were recorded weekly. (F) Representative CD8 (top) and granzyme B (bottom) IHC images on tumors from C. Cells per FOV were quantified as in Figure 2D. n = 3 mice per group (except the combination, which had 2 tumors at endpoint), 6–9 FOV per tumor. *P < 0.05, **P < 0.01, and ****P < 0.0001, by 1-way ANOVA with Tukey’s correction. Scale bars: 50 μm; insets zoomed 200%. (G and H) KrasLSL-G12D/p53wmR172H mice were given adenoviral Cre recombinase intratracheally, and tumor formation was monitored via micro-CT imaging (Supplemental Figure 7D). After tumor development, mice were randomized and treated for 4 weeks. n = 5 mice per group. (G) Individual tumors were measured at weeks 0, 2, and 4 and normalized to week 0. (H) Percentage change of tumor size was calculated between each time point. All individual tumors per mouse were measured, and median growth is shown. n = 5 mice per group. *P < 0.05, by t test.

