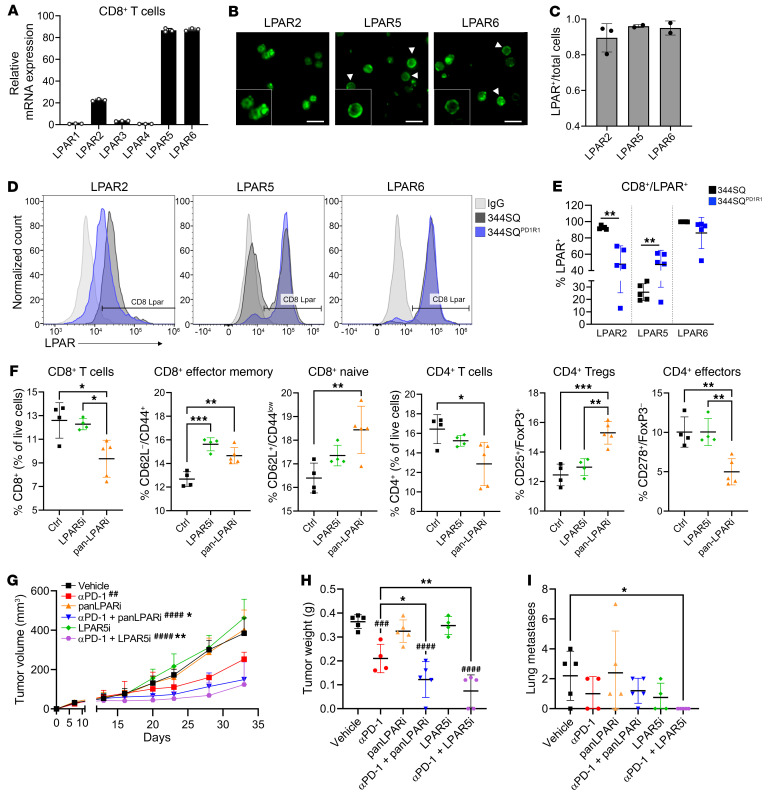
Figure 6. Targeting LPAR5 on CD8+ T cells significantly increases effector functions and antitumor activity.
(A) CD8+ T cells were purified from murine spleens and collected for quantitative PCR analysis of LPARs, which were then normalized to LPAR1. (B) Immunofluorescence images of LPAR2, LPAR5, and LPAR6 on murine CD8+ T cells. Arrowheads denote cells with membranous LPAR. Scale bars: 10 μm; insets zoomed 150%. (C) Images from B were quantified as a fraction of LPAR+ cells compared with total nuclei (DAPI). (D) 344SQ and 344SQPD1R1 cells were implanted into mice (n = 5 mice each). After 3 weeks, tumors were processed for flow cytometry. Each tumor was separated into 3 samples and stained with LPAR2, LPAR5, or LPAR6. Histograms depict CD8+LPAR+ cells. An IgG-stained sample is shown as a negative control. (E) Quantification of the experiment in D, which was completed twice. **P < 0.01, by t test. (F) 344SQPD1R2 cells were cocultured with naive immune cells and treated with vehicle, LPAR5 inhibitor (AS2717638), or pan-LPAR inhibitor (BrP-LPA). Immune cells were then analyzed by flow cytometry. The experiment was completed twice. *P < 0.05, **P < 0.01, and ***P < 0.001, by 1-way ANOVA. (G–I) 344SQ cells were implanted into mice and treated with vehicle, anti–PD-1, BrP-LPA alone or with anti–PD-1, or AS2717638 alone or with anti–PD-1. n = 5 mice per group. (G) Tumor growth was monitored with calipers. ##P < 0.01 and ####P < 0.0001, by 1-way ANOVA compared with vehicle; *P < 0.05 and **P < 0.01, by 1-way ANOVA compared with anti–PD-1. (H) Tumor weight recorded at necropsy. ###P < 0.001 and ####P < 0.0001, by 1-way ANOVA compared with vehicle; *P < 0.05 and **P < 0.01, by 1-way ANOVA compared with anti–PD-1. (I) Lung metastases recorded at necropsy. *P < 0.05, by 1-way ANOVA.

