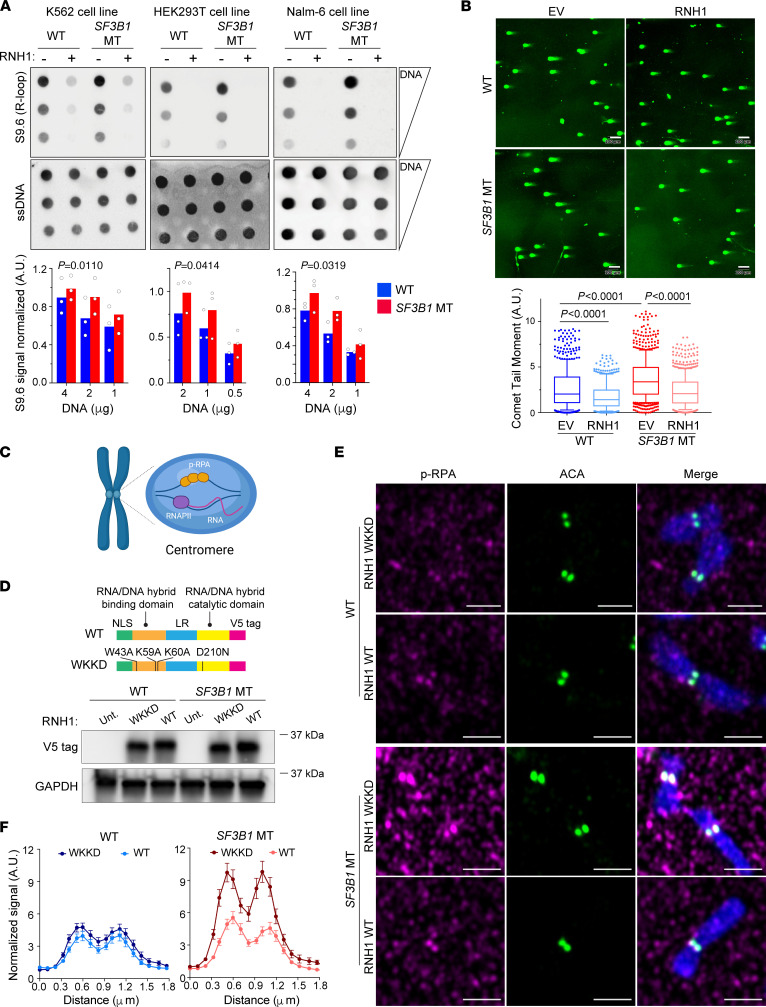
Figure 1. SF3B1 mutation triggers cen-R-loop accumulation.
(A) R-loop level quantified by dotblot assay with S9.6 antibody in K562, HEK293T, and Nalm-6 SF3B1-WT and -MT cells. Serial DNA dilutions starting from 4 mg (K562 and Nalm-6) or 2 mg (HEK293T). Single-strand DNA (ssDNA) blotting was used as loading control. Top: Representative image. Bottom: S9.6 signal quantification over ssDNA signal. Bar graphs represent mean; dots represent biological replicates. Two-way paired ANOVA test. (B) Representative images (top) of neutral comet assay for double-strand breaks in Nalm-6 SF3B1-WT and -MT cells with overexpression of either empty vector (EV) or RNaseH1 (RNH1) and relative comet tail moment (bottom) in 3 biological replicates. Scale bars: 100 μm. Total comets quantified range from 435 to 742 cells. Box plots show the median and 25th and 75th percentiles, with whiskers extending to minimum and maximum values. Two-tailed unpaired t test followed by Bonferroni’s post hoc test. (C) Cen-R-loops are recognized and coated by phospho–RPA S33 (p-RPA). RNAPII, RNA polymerase II. Created with BioRender (biorender.com). (D) Top: RNH1 WT and mutant vectors. NLS, nuclear localization signal; LR, linker region. Bottom: Detection of overexpression of RNH1 with V5 tag by immunoblot in Nalm-6 SF3B1-WT and -MT cells overexpressing either WT or WKKD RNH1 protein. GAPDH was used as loading control. (E) Representative images of cen-R-loops detected by p-RPA (red) and ACA (green) immunofluorescence. Scale bars: 2 μm. (F) Quantified centromeric p-RPA signal normalized to background signal near centromeres (see Methods). Graphs represent mean ± SEM. The number of chromosomes quantified ranges from 46 to 67. SF3B1 MT overexpressing WKKD vs. WT RNH1, P = 0.0001, Wilcoxon’s paired test.

