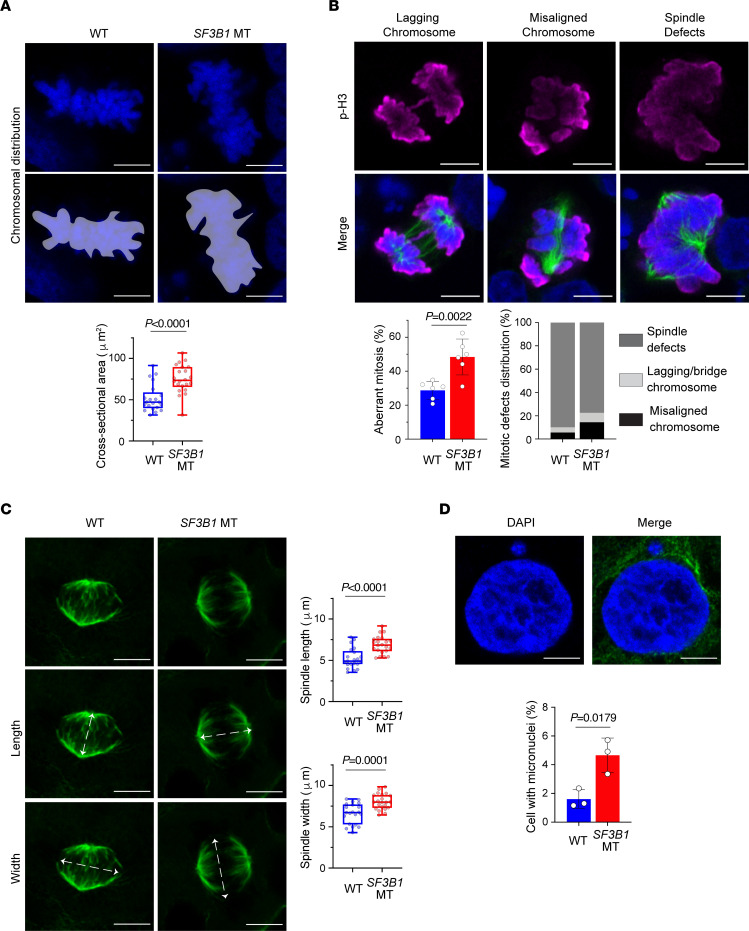
Figure 2. SF3B1-mutant cells have mitotic stress, spindle structure defects, and micronuclei.
(A) Top: Representative confocal maximum intensity projections of entire Z-stack images for measurement of chromosome distribution and alignment during metaphase. Scale bars: 5 μm. Purple areas indicate the area measured. Bottom: Quantification of chromosome area above. (B) Top: Representative images of mitotic cells with lagging chromosomes and chromosomes bridges, misaligned chromosomes, and multipolar spindles. Mitotic cells marked with H3–serine 10 (p-H3) antibody (magenta); spindles marked with α-tubulin antibody (green); nuclei marked with DAPI (blue). Scale bars: 5 μm. Bottom: Quantification of aberrant mitosis frequency, expressed as percentage of total mitosis encountered, and distribution of mitotic defects expressed as percentage of total aberrant mitotic cells. (C) Left: Representative maximum intensity projections of mitotic spindle architecture of cells in metaphase. Arrows indicate definition of length (middle panel) and width (bottom panel). Green, α-tubulin. Scale bars: 5 μm. Right: Relative spindle length and width quantification. (D) Top: Representative image of cell with micronuclei. Blue, nuclei (DAPI); green, α-tubulin. Scale bars: 5 μm. Bottom: Quantification of frequency of micronuclei. Data are expressed as percentage of total cells. All panels show data in HEK293T SF3B1-WT and -MT cells. Box plots show the median and 25th and 75th percentiles, with whiskers extending to minimum and maximum values. Bar plots represent mean ± SD. Each dot represents a biological replicate. Two-tailed unpaired t test.

